Sample data
Datasets you can paste straight into Power BI to try the Parliament Chart in both data shapes, without touching your own model.
Each one comes with a DAX version you can paste into Modeling → New table in Power BI Desktop, which is the fastest way to get a working chart on screen.
The chamber compositions below are drawn from published election results and are here to demonstrate the visual, not to serve as a reference. Check the current composition before using any of them in a real report.
1. A small chamber — party totals
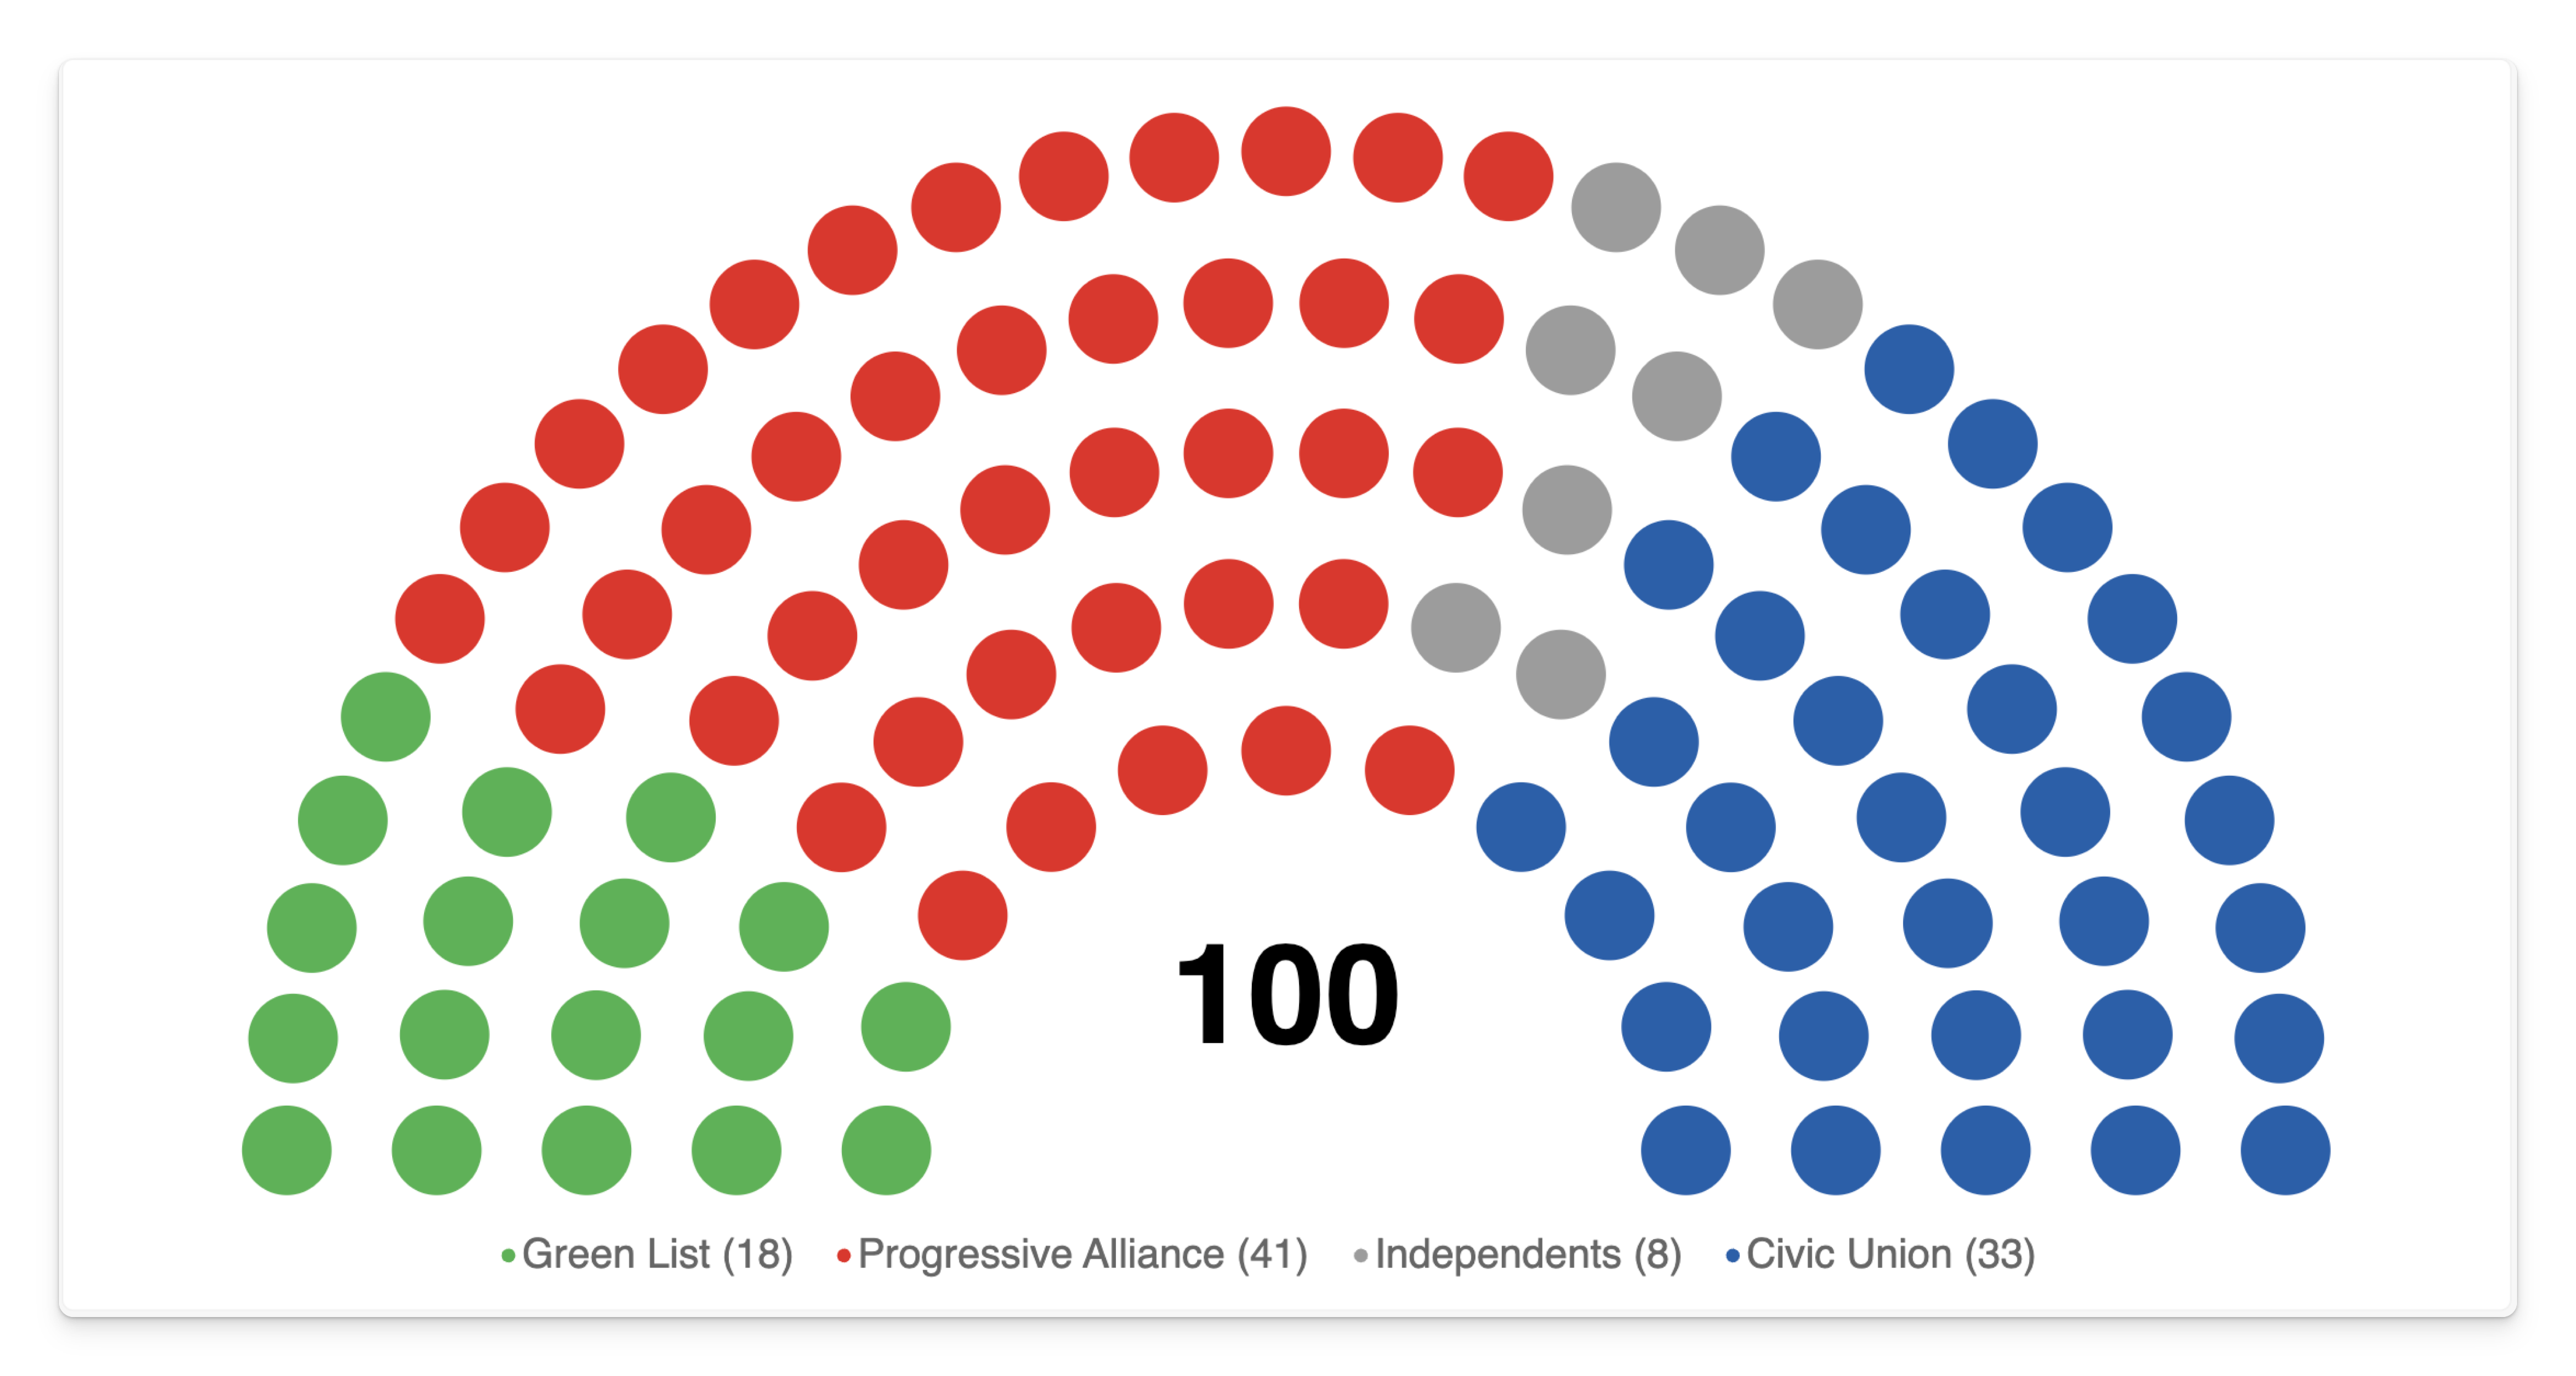
The simplest complete setup: 100 seats, four parties, with an order and colours.
| Party | Seats | Sort Order | Colour |
|---|---|---|---|
| Green List | 18 | 1 | #5FB158 |
| Progressive Alliance | 41 | 2 | #D8382E |
| Independents | 8 | 3 | #9C9C9C |
| Civic Union | 33 | 4 | #2B5FA8 |
Chamber =
DATATABLE (
    "Party", STRING,
    "Seats", INTEGER,
    "Sort Order", INTEGER,
    "Colour", STRING,
    {
        { "Green List", 18, 1, "#5FB158" },
        { "Progressive Alliance", 41, 2, "#D8382E" },
        { "Independents", 8, 3, "#9C9C9C" },
        { "Civic Union", 33, 4, "#2B5FA8" }
    }
)
Bind: Party → Party · Seats → Seat Count · Sort Order → Sort Order · Colour → Custom Color.
Settings: Arc 180, Legend Bottom center with Seat counts on.
2. A large chamber — UK House of Commons
650 seats across 15 groups. A good stress test for legend layout, thin wedges and left-to-right ordering.
| Party | Seats | Sort Order | Colour |
|---|---|---|---|
| Sinn Féin | 7 | 1 | #326760 |
| SDLP | 2 | 2 | #2AA82C |
| Green | 4 | 3 | #6AB023 |
| Plaid Cymru | 4 | 4 | #005B54 |
| SNP | 9 | 5 | #FDF38E |
| Labour | 411 | 6 | #E4003B |
| Liberal Democrats | 72 | 7 | #FAA61A |
| Alliance | 1 | 8 | #F6CB2F |
| Independent | 6 | 9 | #909090 |
| Speaker | 1 | 10 | #BBBBBB |
| UUP | 1 | 11 | #48A5EE |
| DUP | 5 | 12 | #D46A4C |
| TUV | 1 | 13 | #0C3A6A |
| Conservative | 121 | 14 | #0087DC |
| Reform UK | 5 | 15 | #12B6CF |
Commons =
DATATABLE (
    "Party", STRING,
    "Seats", INTEGER,
    "Sort Order", INTEGER,
    "Colour", STRING,
    {
        { "Sinn Féin", 7, 1, "#326760" },
        { "SDLP", 2, 2, "#2AA82C" },
        { "Green", 4, 3, "#6AB023" },
        { "Plaid Cymru", 4, 4, "#005B54" },
        { "SNP", 9, 5, "#FDF38E" },
        { "Labour", 411, 6, "#E4003B" },
        { "Liberal Democrats", 72, 7, "#FAA61A" },
        { "Alliance", 1, 8, "#F6CB2F" },
        { "Independent", 6, 9, "#909090" },
        { "Speaker", 1, 10, "#BBBBBB" },
        { "UUP", 1, 11, "#48A5EE" },
        { "DUP", 5, 12, "#D46A4C" },
        { "TUV", 1, 13, "#0C3A6A" },
        { "Conservative", 121, 14, "#0087DC" },
        { "Reform UK", 5, 15, "#12B6CF" }
    }
)
Settings: Arc 180, Legend Right (15 entries don't fit in a single row), Seat counts on, Show Total Seats on.
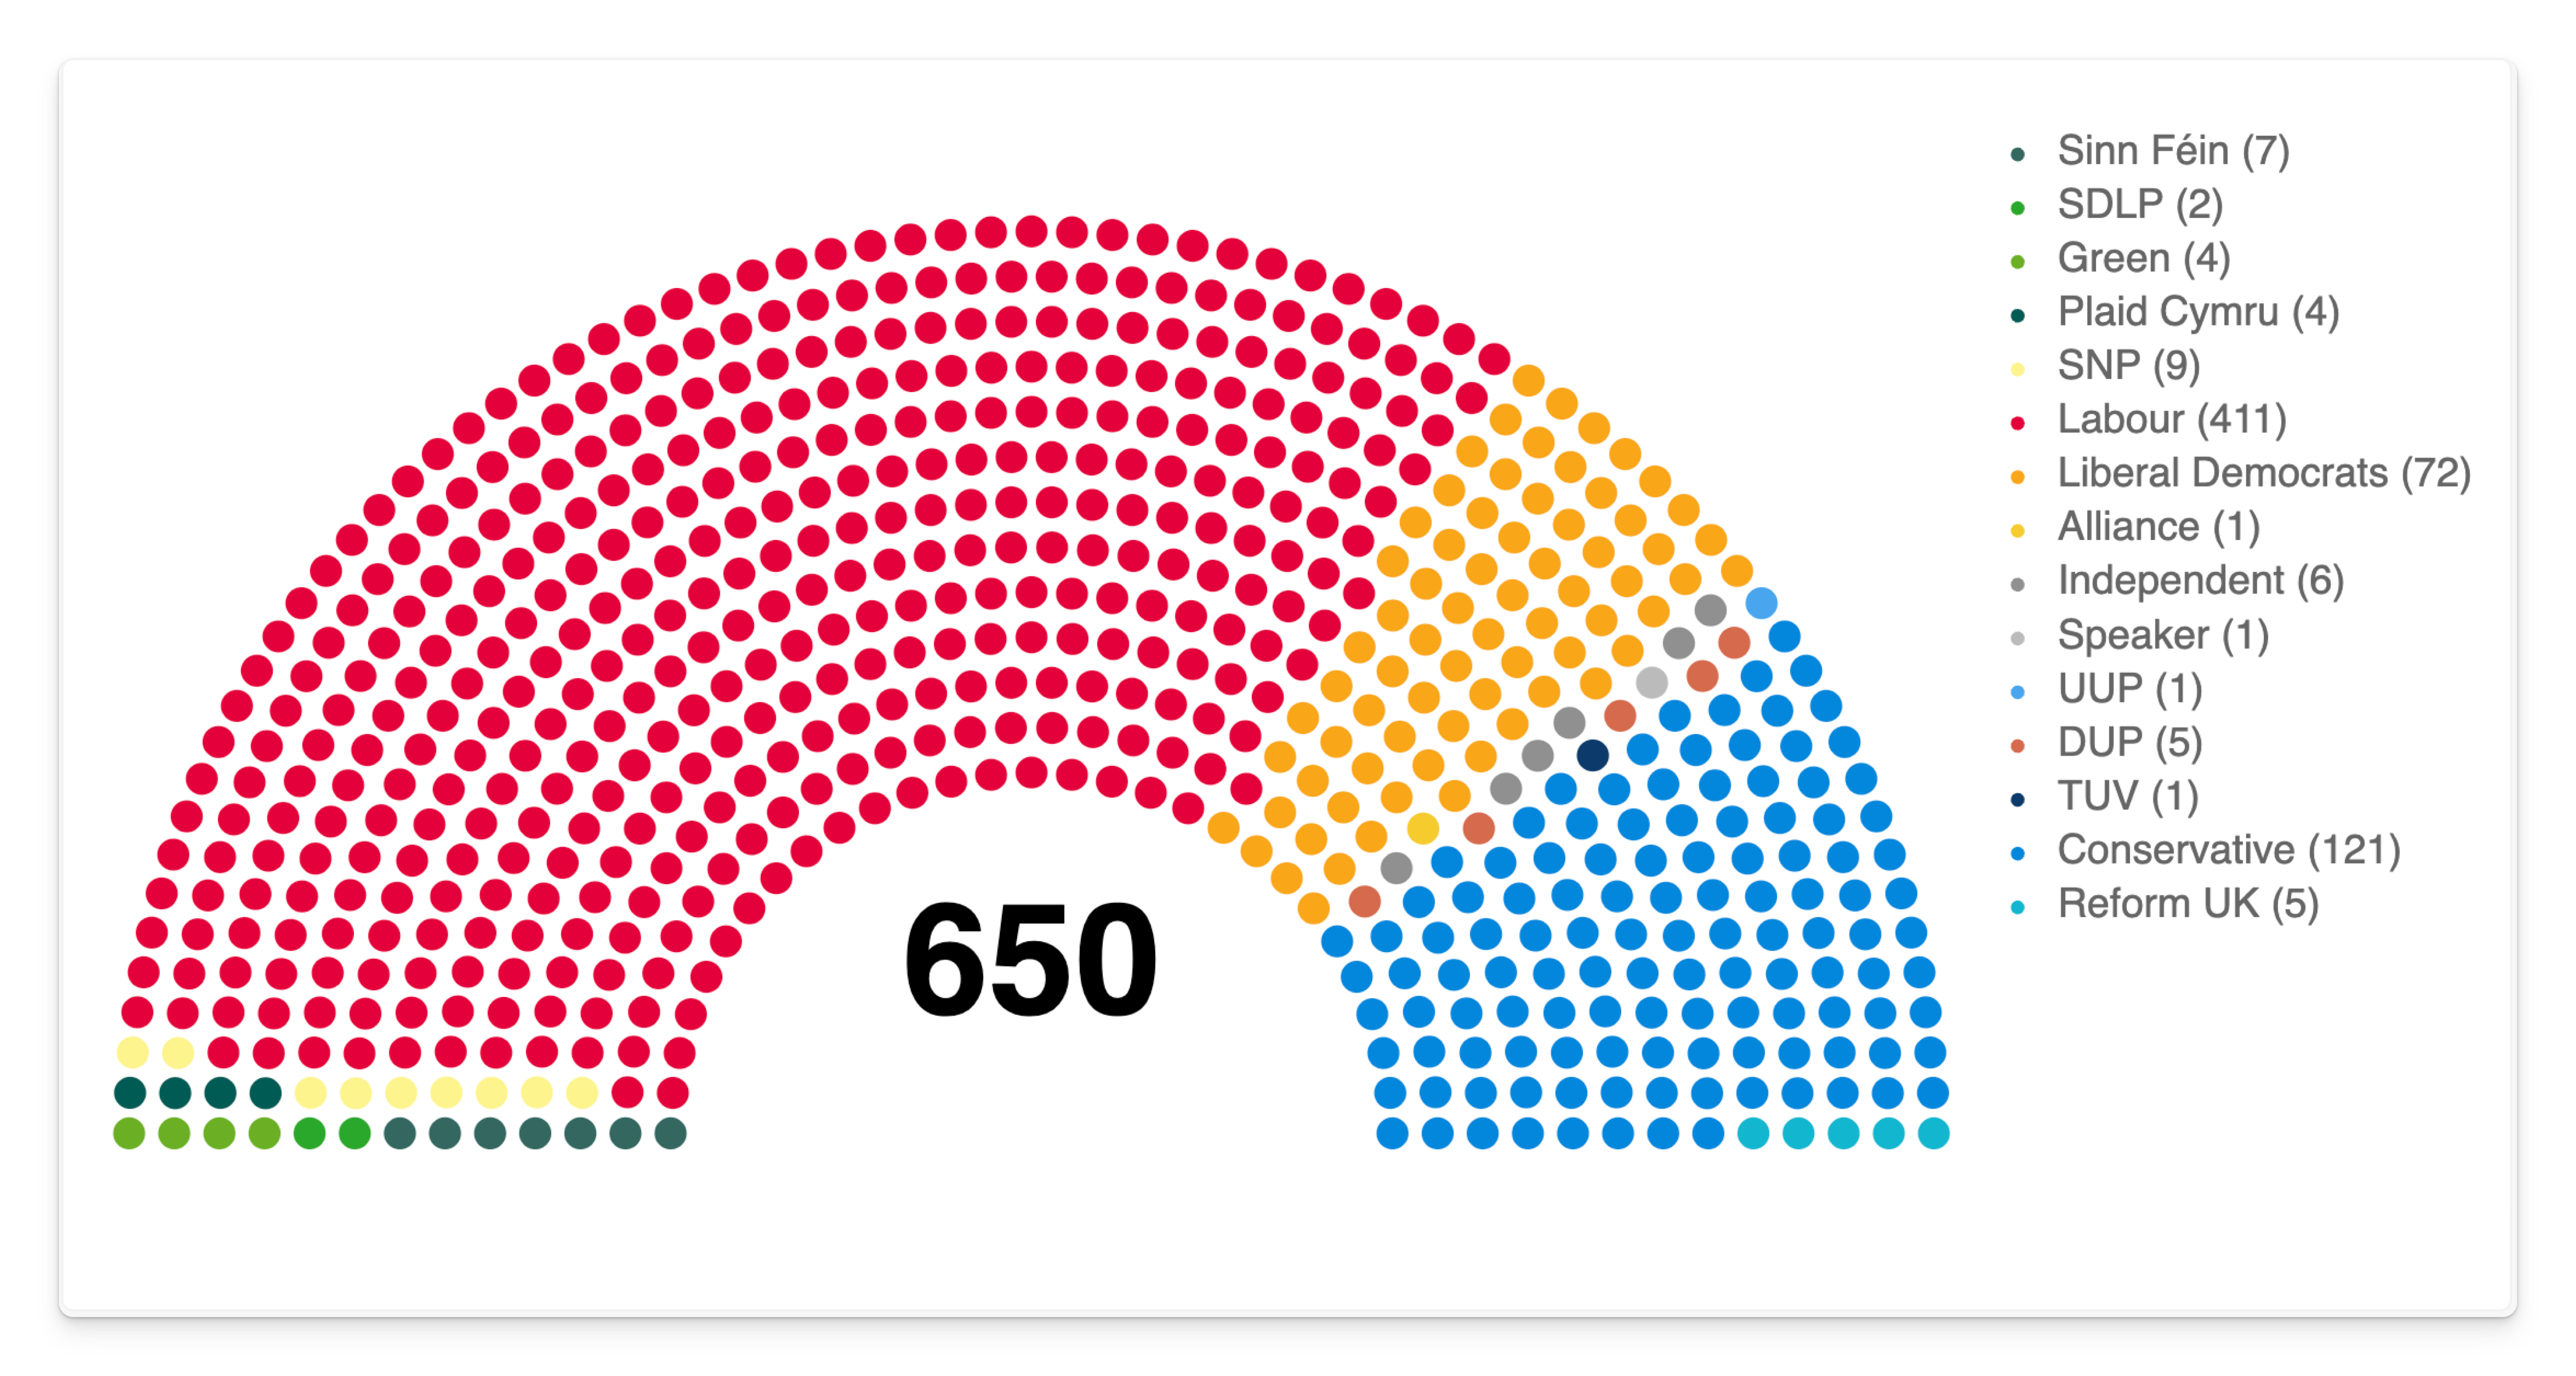
A majority is 326 of 650. The visual doesn't draw a majority line — put the threshold in a card visual beside the chart, or see No majority line.
3. A wide hemicycle — European Parliament
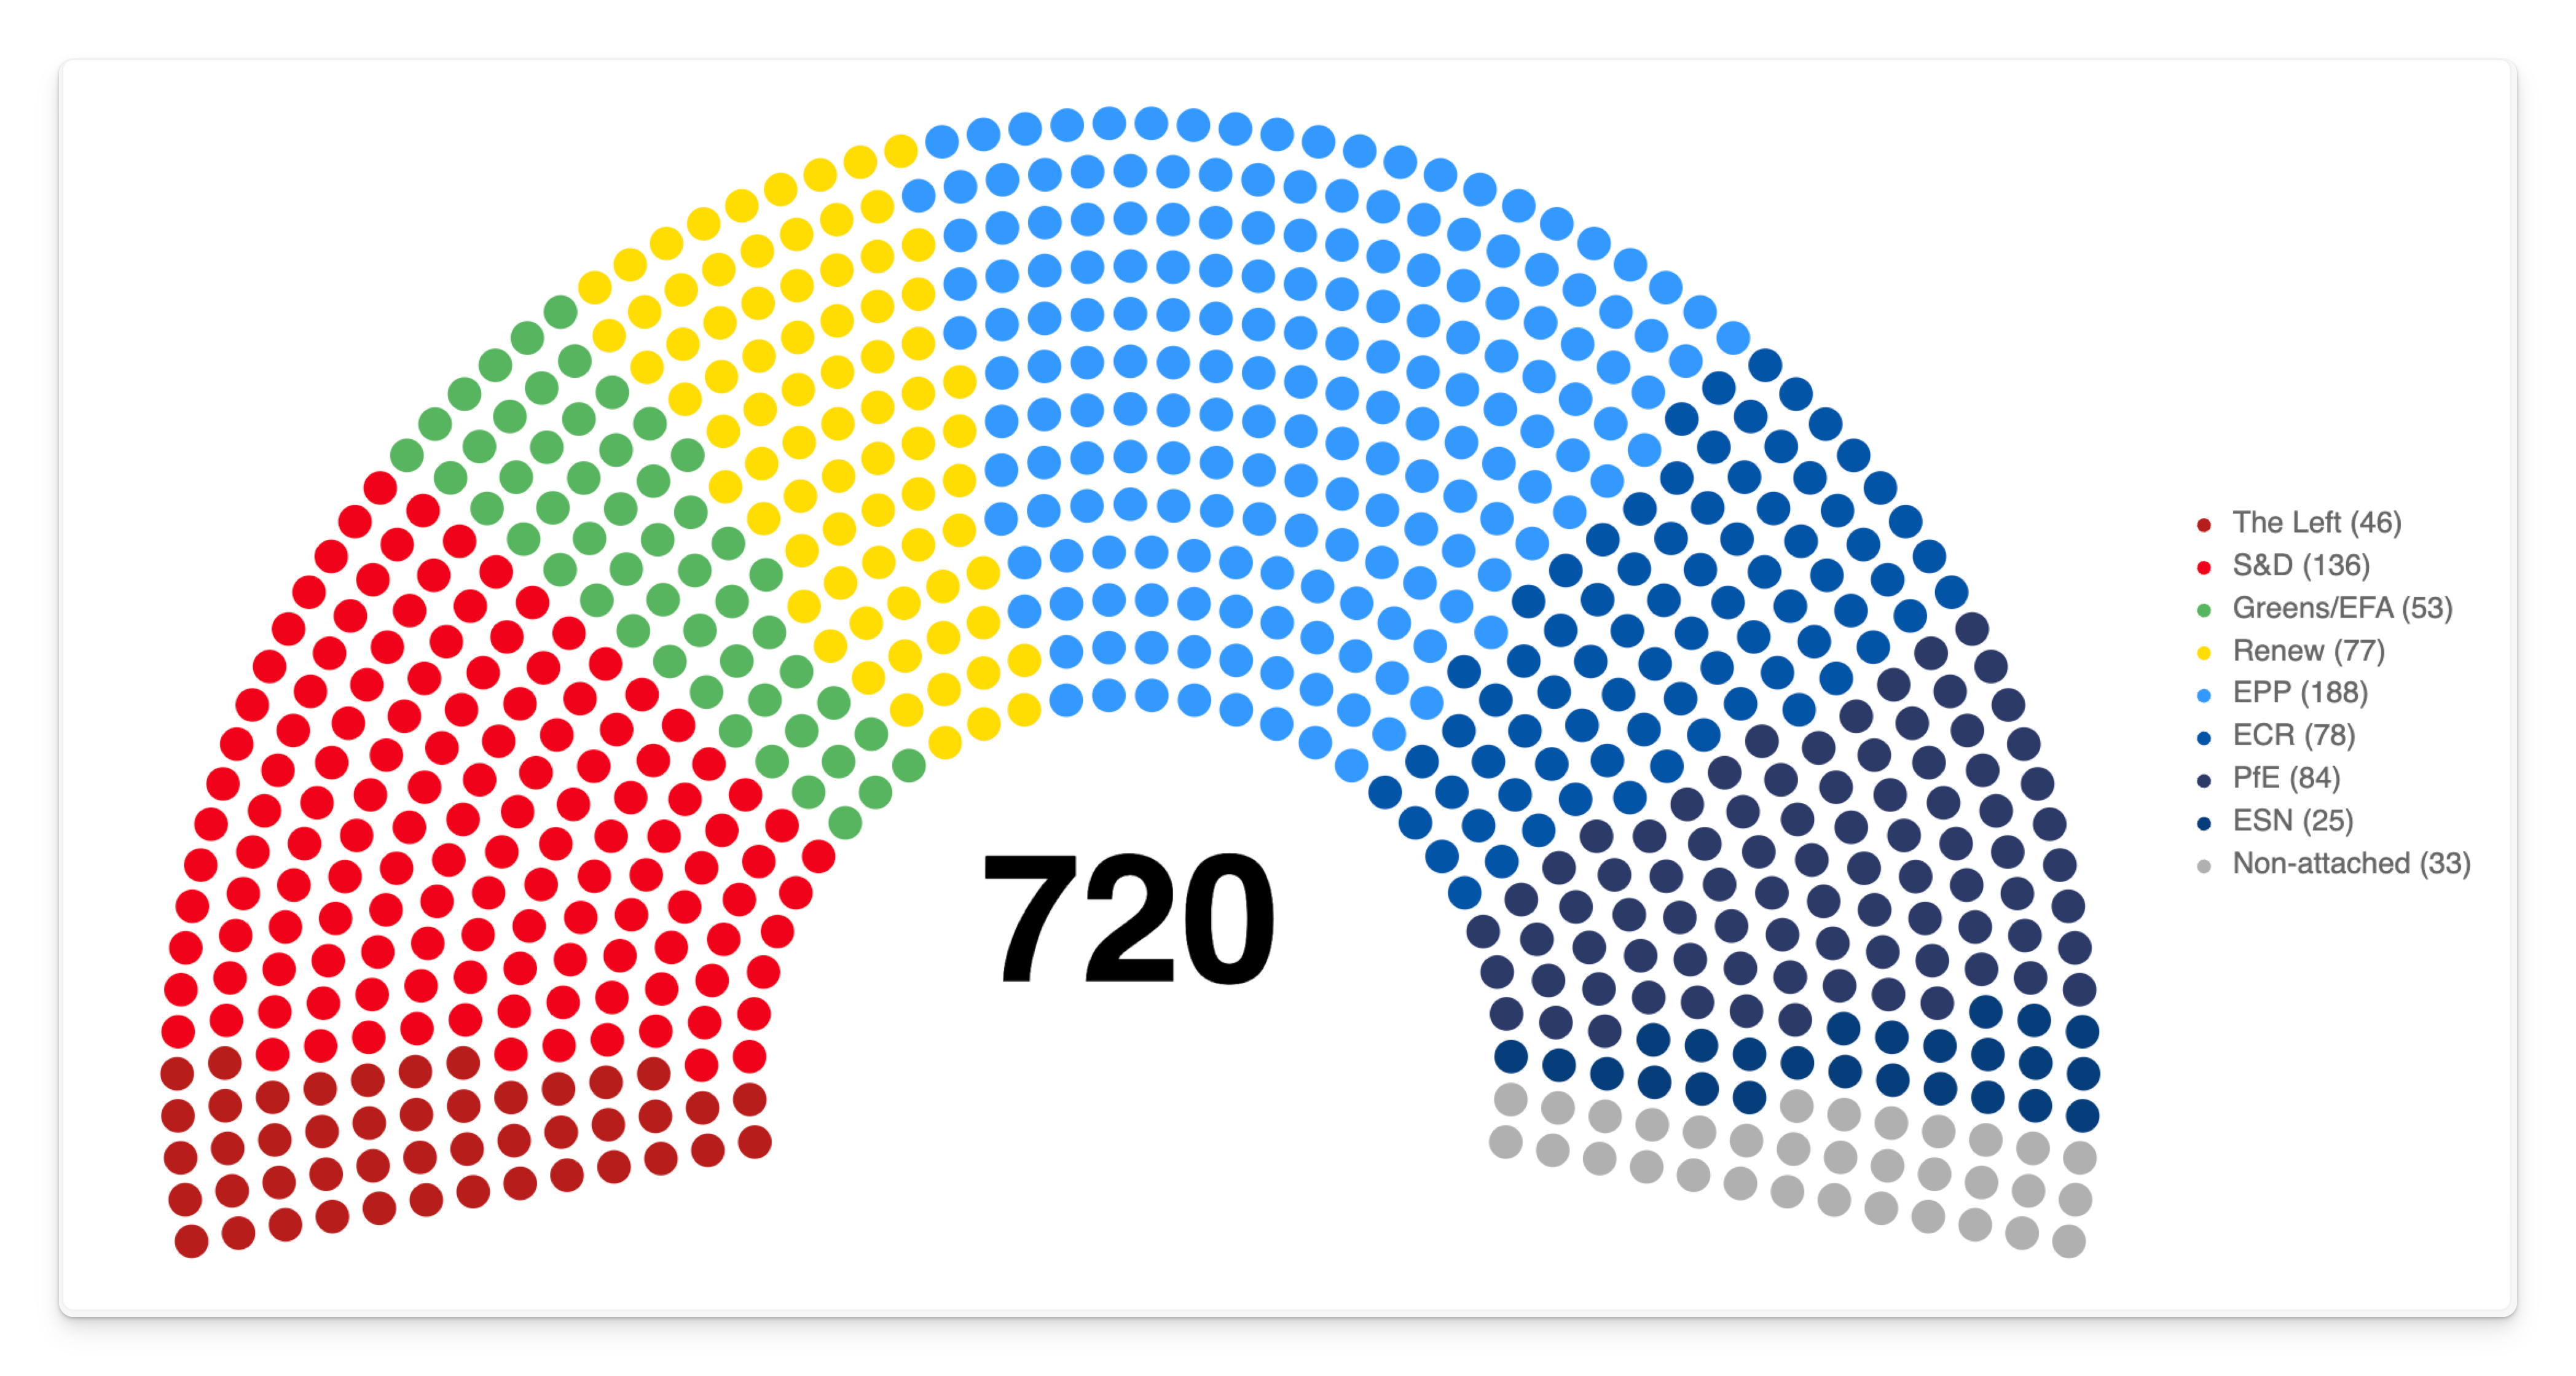
720 seats across nine political groups. Sort Order matters more here than anywhere: the groups run left to right along a recognised political axis.
| Group | Seats | Sort Order | Colour |
|---|---|---|---|
| The Left | 46 | 1 | #B71C1C |
| S&D | 136 | 2 | #F0001C |
| Greens/EFA | 53 | 3 | #57B45F |
| Renew | 77 | 4 | #FFDD00 |
| EPP | 188 | 5 | #3399FF |
| ECR | 78 | 6 | #0054A5 |
| PfE | 84 | 7 | #2B3A67 |
| ESN | 25 | 8 | #063E7B |
| Non-attached | 33 | 9 | #B0B0B0 |
EuroParliament =
DATATABLE (
    "Group", STRING,
    "Seats", INTEGER,
    "Sort Order", INTEGER,
    "Colour", STRING,
    {
        { "The Left", 46, 1, "#B71C1C" },
        { "S&D", 136, 2, "#F0001C" },
        { "Greens/EFA", 53, 3, "#57B45F" },
        { "Renew", 77, 4, "#FFDD00" },
        { "EPP", 188, 5, "#3399FF" },
        { "ECR", 78, 6, "#0054A5" },
        { "PfE", 84, 7, "#2B3A67" },
        { "ESN", 25, 8, "#063E7B" },
        { "Non-attached", 33, 9, "#B0B0B0" }
    }
)
Settings: Arc 200 for a wider, flatter hemicycle, Legend Right center to keep all nine names visible, Seat counts on.
4. One row per seat — a committee
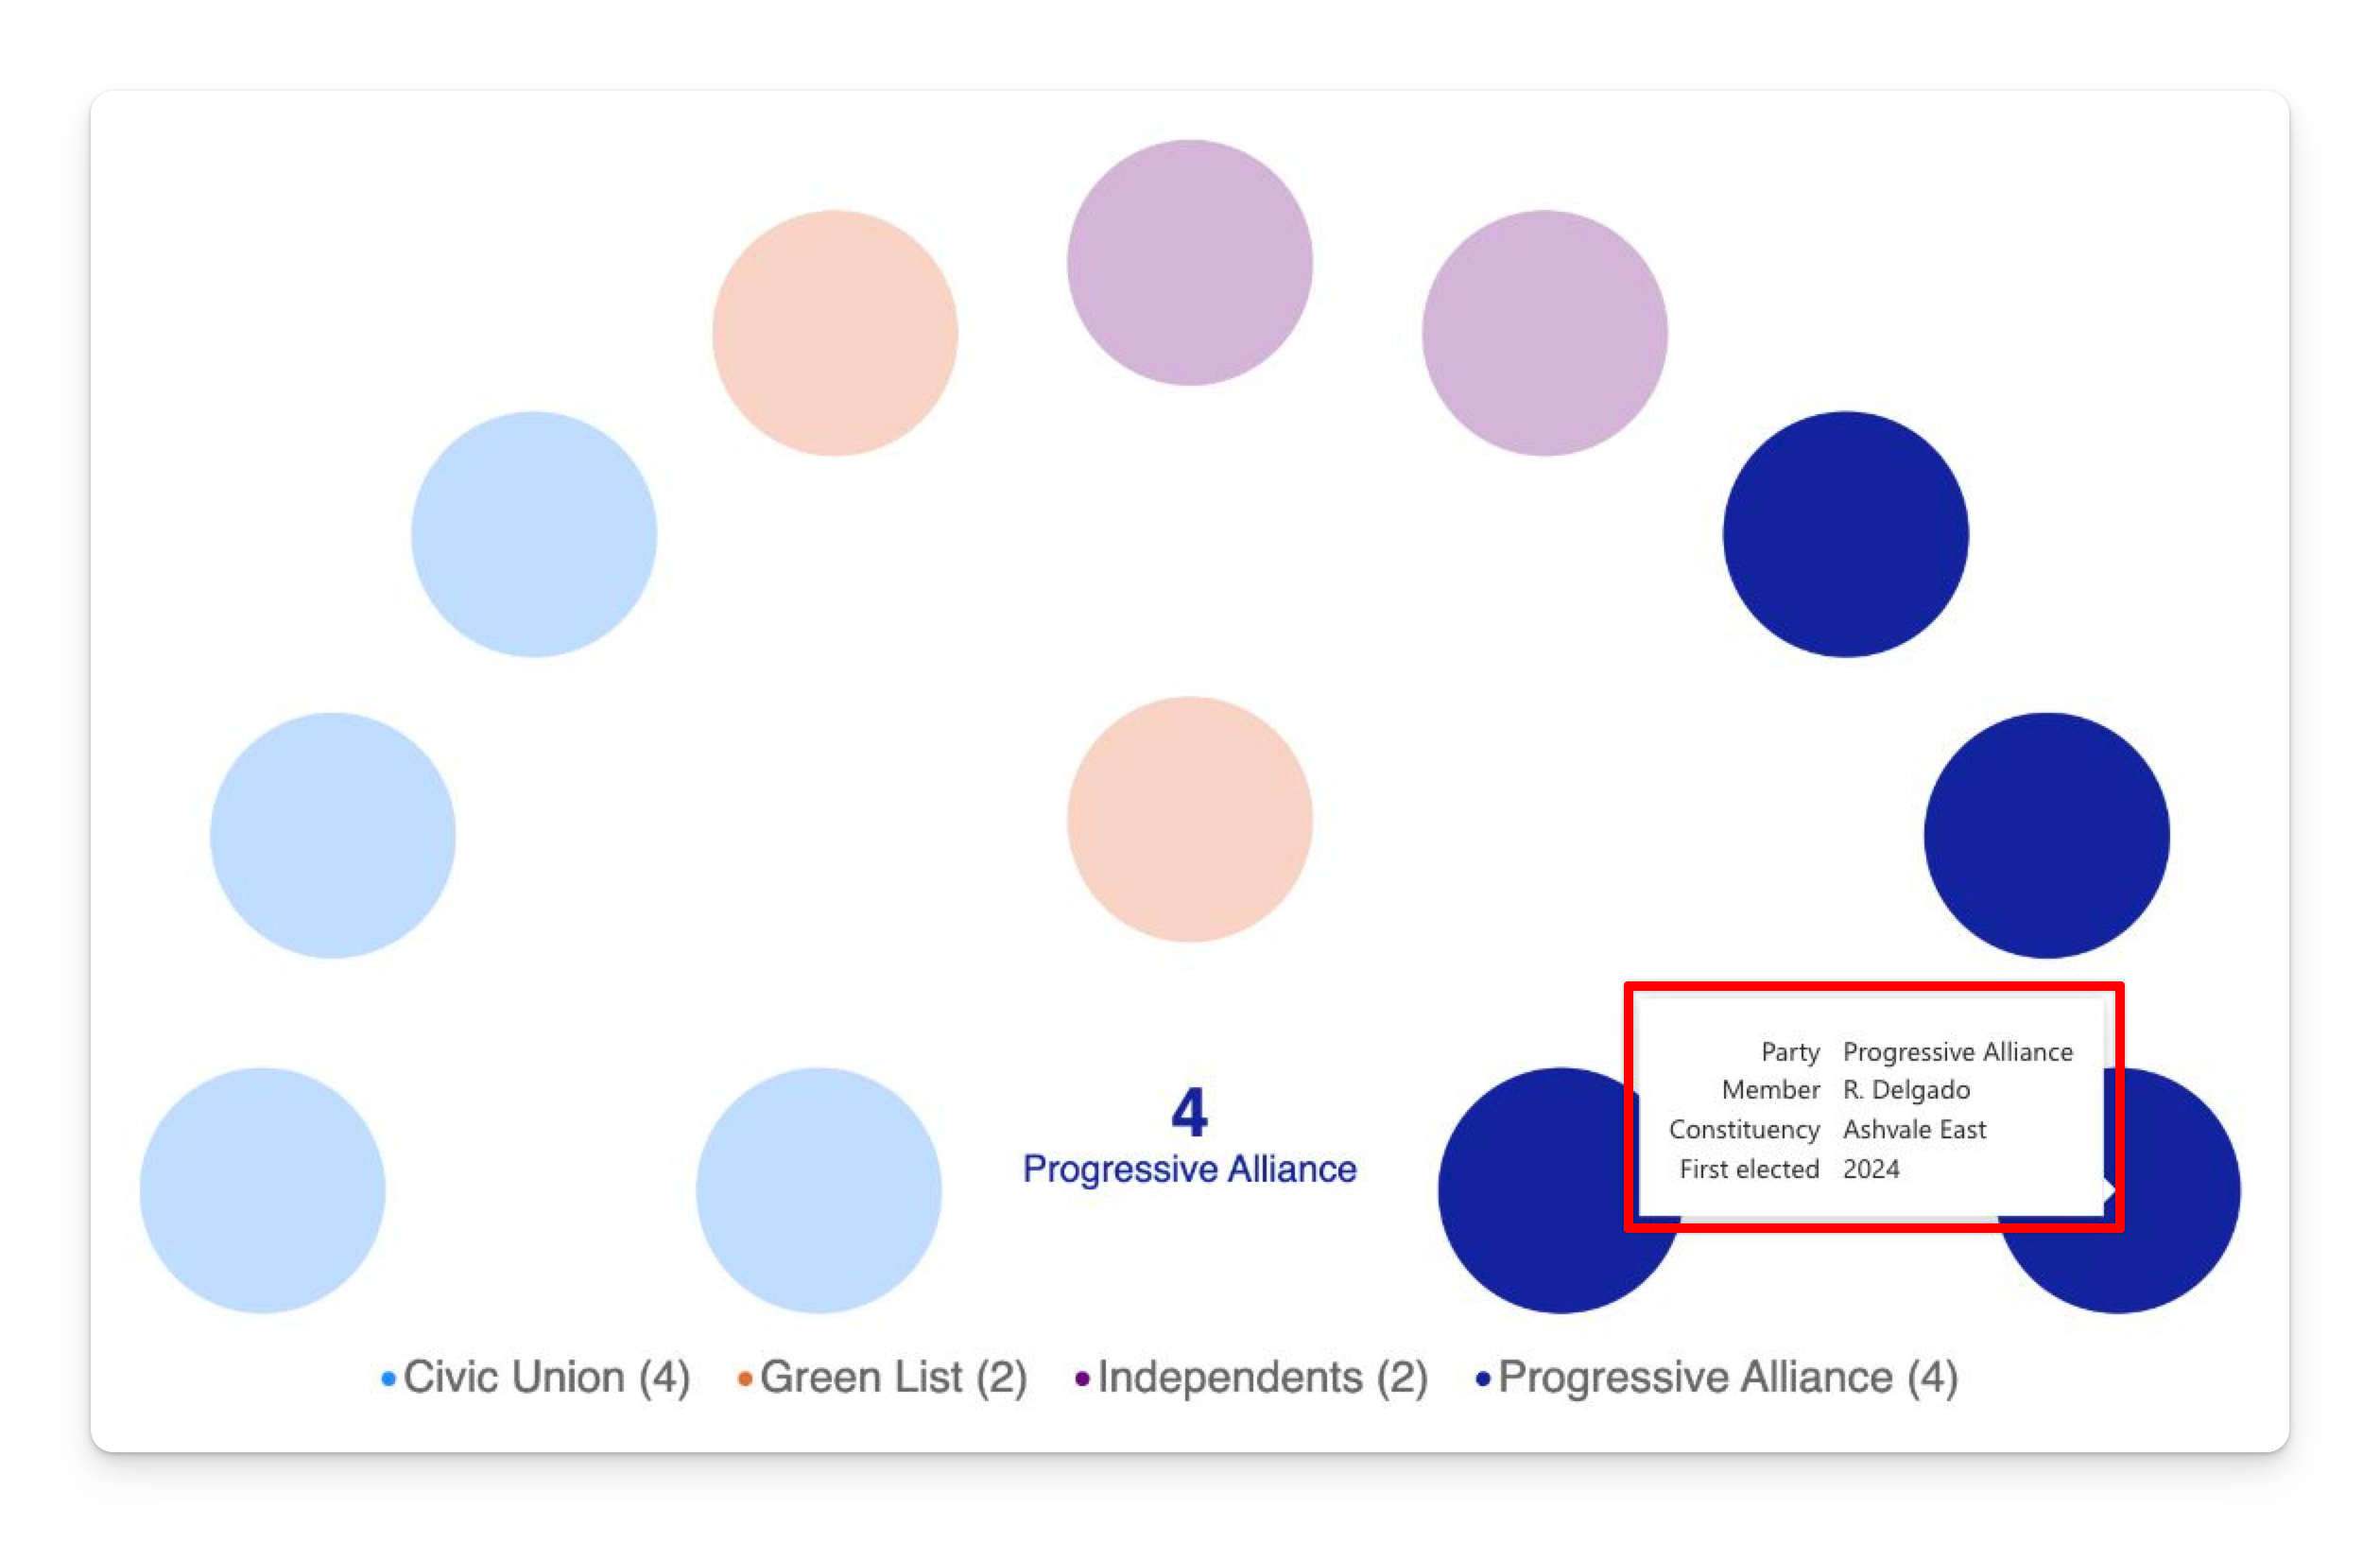
Twelve seats, each carrying its own member. Use this to see per-seat tooltips working.
| Seat ID | Member | Party | Constituency | First elected |
|---|---|---|---|---|
| S-001 | A. Whitcombe | Progressive Alliance | Northgate | 2019 |
| S-002 | R. Delgado | Progressive Alliance | Ashvale East | 2024 |
| S-003 | P. Ferreira | Progressive Alliance | Cardew | 2015 |
| S-004 | N. Haddad | Progressive Alliance | Northgate West | 2024 |
| S-005 | M. Osei | Civic Union | Kingsmere | 2015 |
| S-006 | J. Brennan | Civic Union | Halloway | 2019 |
| S-007 | T. Nakamura | Civic Union | Stonebridge | 2024 |
| S-008 | L. Vasquez | Civic Union | Eastmoor | 2011 |
| S-009 | K. Lindqvist | Green List | Fenbrook | 2024 |
| S-010 | D. Achterberg | Green List | Wyecombe | 2019 |
| S-011 | S. Iyer | Independents | Marbury | 2024 |
| S-012 | C. Duforest | Independents | Pellhurst | 2015 |
Members =
DATATABLE (
    "Seat ID", STRING,
    "Member", STRING,
    "Party", STRING,
    "Constituency", STRING,
    "First elected", STRING,
    {
        { "S-001", "A. Whitcombe", "Progressive Alliance", "Northgate", "2019" },
        { "S-002", "R. Delgado", "Progressive Alliance", "Ashvale East", "2024" },
        { "S-003", "P. Ferreira", "Progressive Alliance", "Cardew", "2015" },
        { "S-004", "N. Haddad", "Progressive Alliance", "Northgate West", "2024" },
        { "S-005", "M. Osei", "Civic Union", "Kingsmere", "2015" },
        { "S-006", "J. Brennan", "Civic Union", "Halloway", "2019" },
        { "S-007", "T. Nakamura", "Civic Union", "Stonebridge", "2024" },
        { "S-008", "L. Vasquez", "Civic Union", "Eastmoor", "2011" },
        { "S-009", "K. Lindqvist", "Green List", "Fenbrook", "2024" },
        { "S-010", "D. Achterberg", "Green List", "Wyecombe", "2019" },
        { "S-011", "S. Iyer", "Independents", "Marbury", "2024" },
        { "S-012", "C. Duforest", "Independents", "Pellhurst", "2015" }
    }
)
Bind: Party → Party · Seat ID → Seat ID · Member, Constituency, First elected → Tooltips.
Also add a Seats = COUNTROWS ( 'Members' ) measure to Seat Count, so other visuals can dim the arch — see Being filtered by other visuals.
Keep First elected as text so the tooltip displays the full year instead of abbreviating it as a quantity.
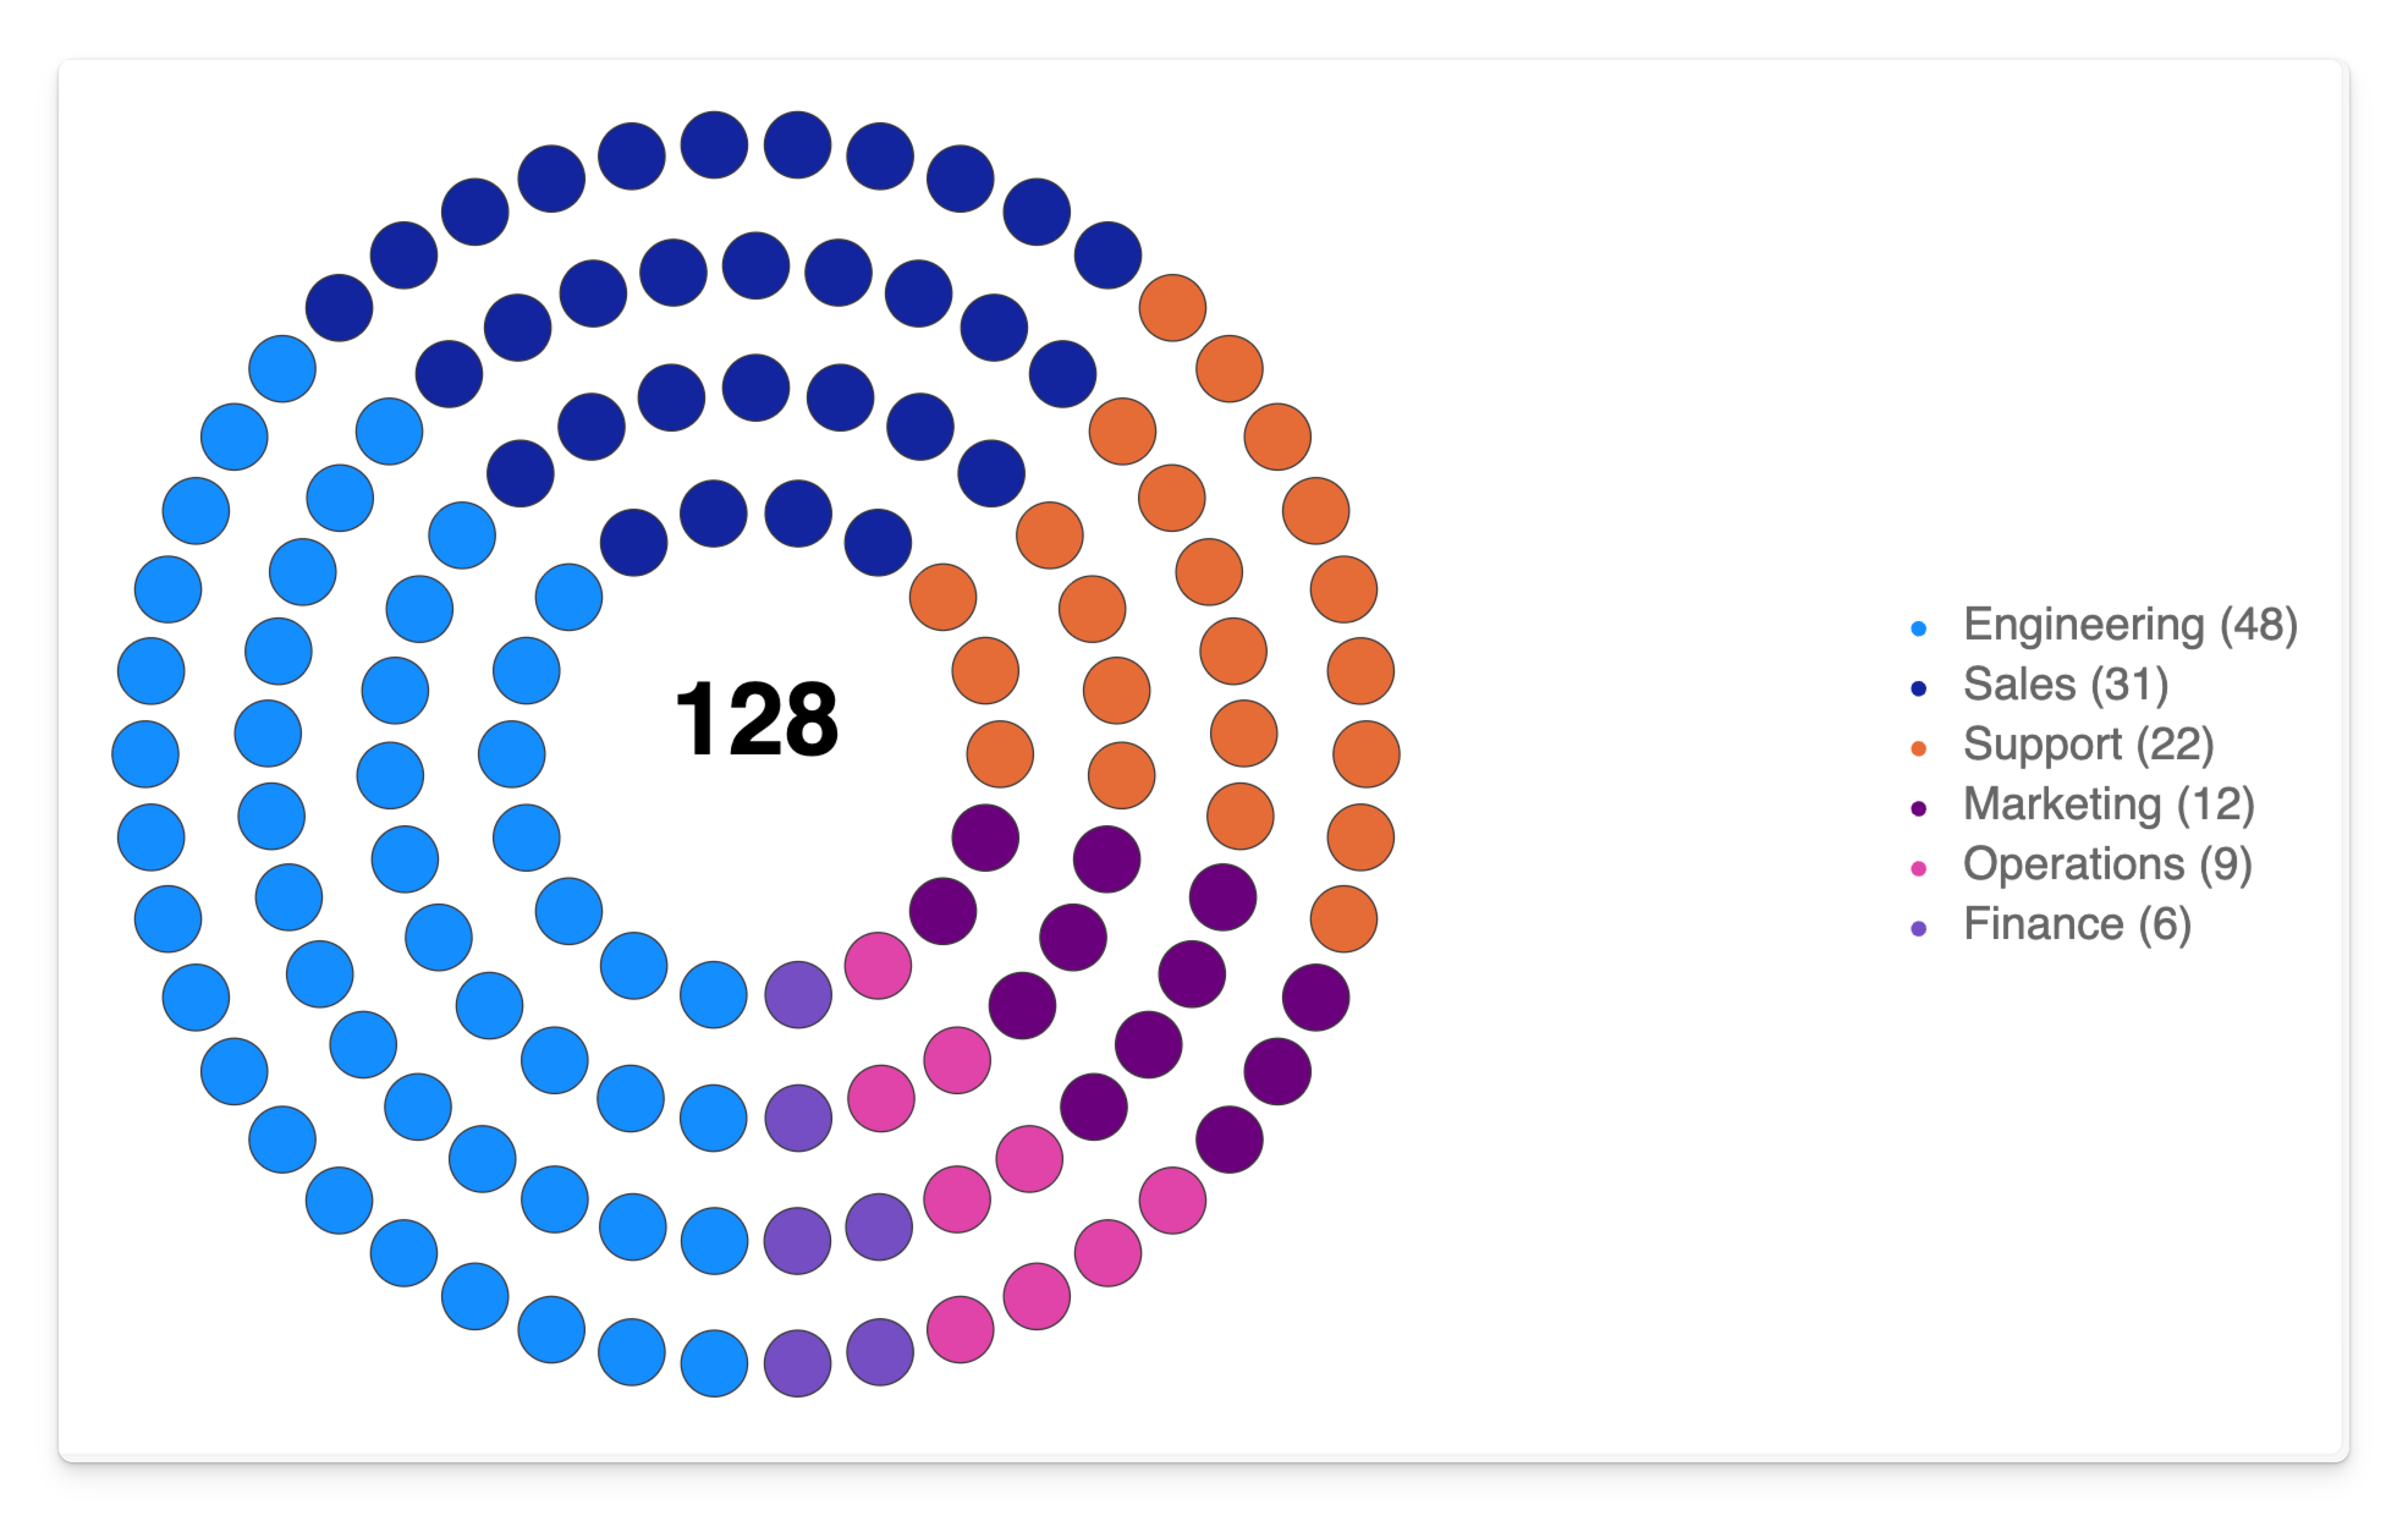
5. Nothing to do with politics — a headcount ring
The same visual at 360° is a countable dot chart of any category.
| Team | Headcount | Sort Order |
|---|---|---|
| Engineering | 48 | 1 |
| Sales | 31 | 2 |
| Support | 22 | 3 |
| Marketing | 12 | 4 |
| Operations | 9 | 5 |
| Finance | 6 | 6 |
Headcount =
DATATABLE (
    "Team", STRING,
    "Headcount", INTEGER,
    "Sort Order", INTEGER,
    {
        { "Engineering", 48, 1 },
        { "Sales", 31, 2 },
        { "Support", 22, 3 },
        { "Marketing", 12, 4 },
        { "Operations", 9, 5 },
        { "Finance", 6, 6 }
    }
)
Settings: Arc 360, Seat outline on (it separates the dots nicely at this size), Legend Right center, Seat counts on.
Expanding totals into one row per seat
If you have a totals table and want per-seat rows, the cleanest route is Power Query — see Party totals → one row per seat. If you'd rather stay in DAX, this builds the expanded table from the Chamber table above:
Chamber Seats =
VAR Expanded =
    GENERATE (
        Chamber,
        SELECTCOLUMNS ( GENERATESERIES ( 1, Chamber[Seats] ), "Seat No", [Value] )
    )
RETURN
    ADDCOLUMNS (
        Expanded,
        "Seat ID", Chamber[Party] & "-" & FORMAT ( [Seat No], "000" )
    )
The Seat ID expression prefixes the party name deliberately — Seat IDs must be unique across the whole dataset, and a bare 1, 2, 3… per party is not.
Power Query is the better home for this in a production model: a calculated table is recomputed on every refresh, and it can't be folded back to the source.
Next steps
- Layout & arc — get the shape and the ordering right.
- Legend & colours — the three places a party colour can come from.
- Use cases — more scenarios, with recommended settings.