Parliament Chart
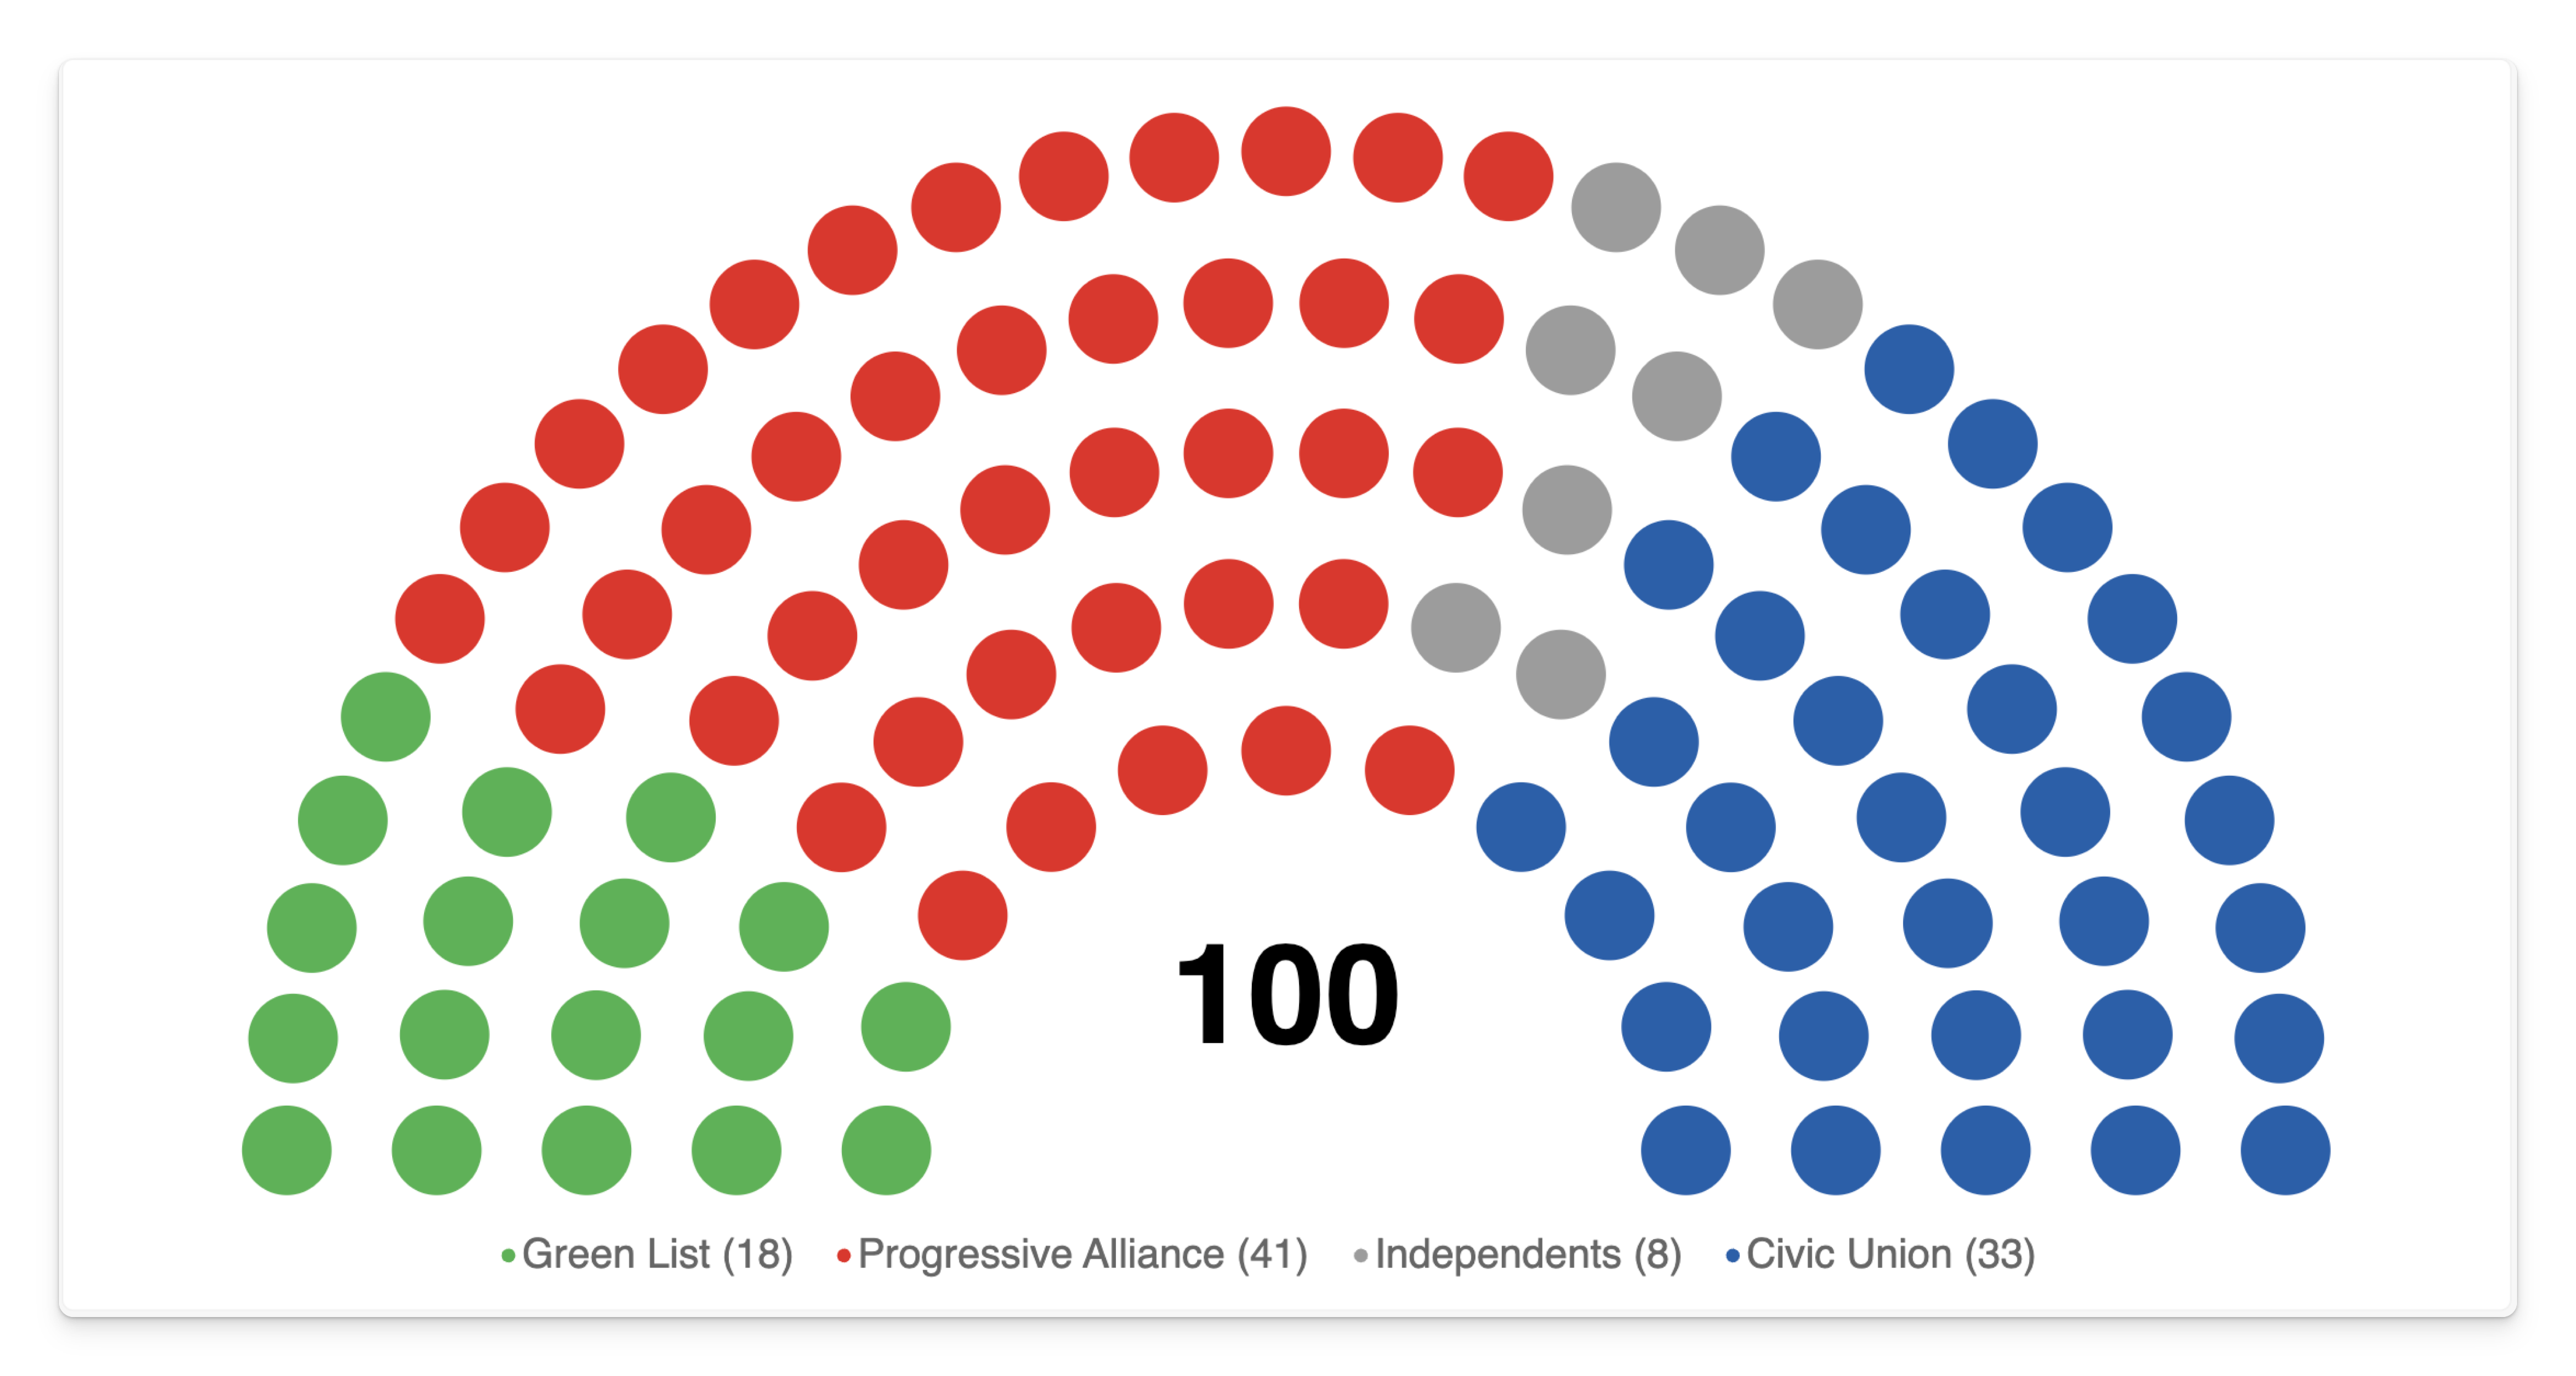
The Parliament Chart by ChartPad is a custom Power BI visual that draws one dot per seat, arranged in an arch. It is the standard way to show the composition of a body: who holds how many seats, which blocs sit next to each other, and whether anyone has a majority.
Its arc is adjustable from a narrow 90° wedge through the classic 180° hemicycle to a full 360° ring, so the same visual covers a Westminster-style chamber, a European hemicycle, and a circular dot chart of any categorical breakdown.
What it can do
- Two data shapes, both first-class — bind aggregated party totals (one row per party plus a seat count), or one row per seat for per-member tooltips. See Shaping your data.
- Adjustable arc — anything from 90° to a closed 360° ring, with rows, seat size and spacing all worked out for you.
- Political left-to-right ordering — a Sort Order field puts parties round the arch in the order your audience expects, not alphabetically.
- Data-driven colours — a hex colour column in your model, a colour picker per party, or your report theme palette.
- Live centre label — the total seat count sits in the middle of the arch and switches to the hovered or selected party's own count, in that party's colour.
- Party-wide hover — hovering anywhere in a party's wedge lights the whole wedge and names it, without filtering anything.
- Cross-filtering — click a wedge or a legend entry to filter the rest of the report; ctrl+click to multi-select.
- Seat counts in the legend — append each party's total to its legend entry.
- Rich tooltips — the party plus any fields you add, including report-page tooltips.
- International — the interface is translated into 36 languages, and your values follow their model format strings.
- High-contrast aware — the visual switches to the Windows system palette when high contrast is on.
The Parliament Chart is a Microsoft-certified Power BI visual: its code has been reviewed and tested to confirm it doesn't access any external services, so your data never leaves Power BI. Certified visuals are safe for enterprise use and support export to PowerPoint/PDF and email subscriptions. See Certified by Microsoft.
Anatomy of the visual
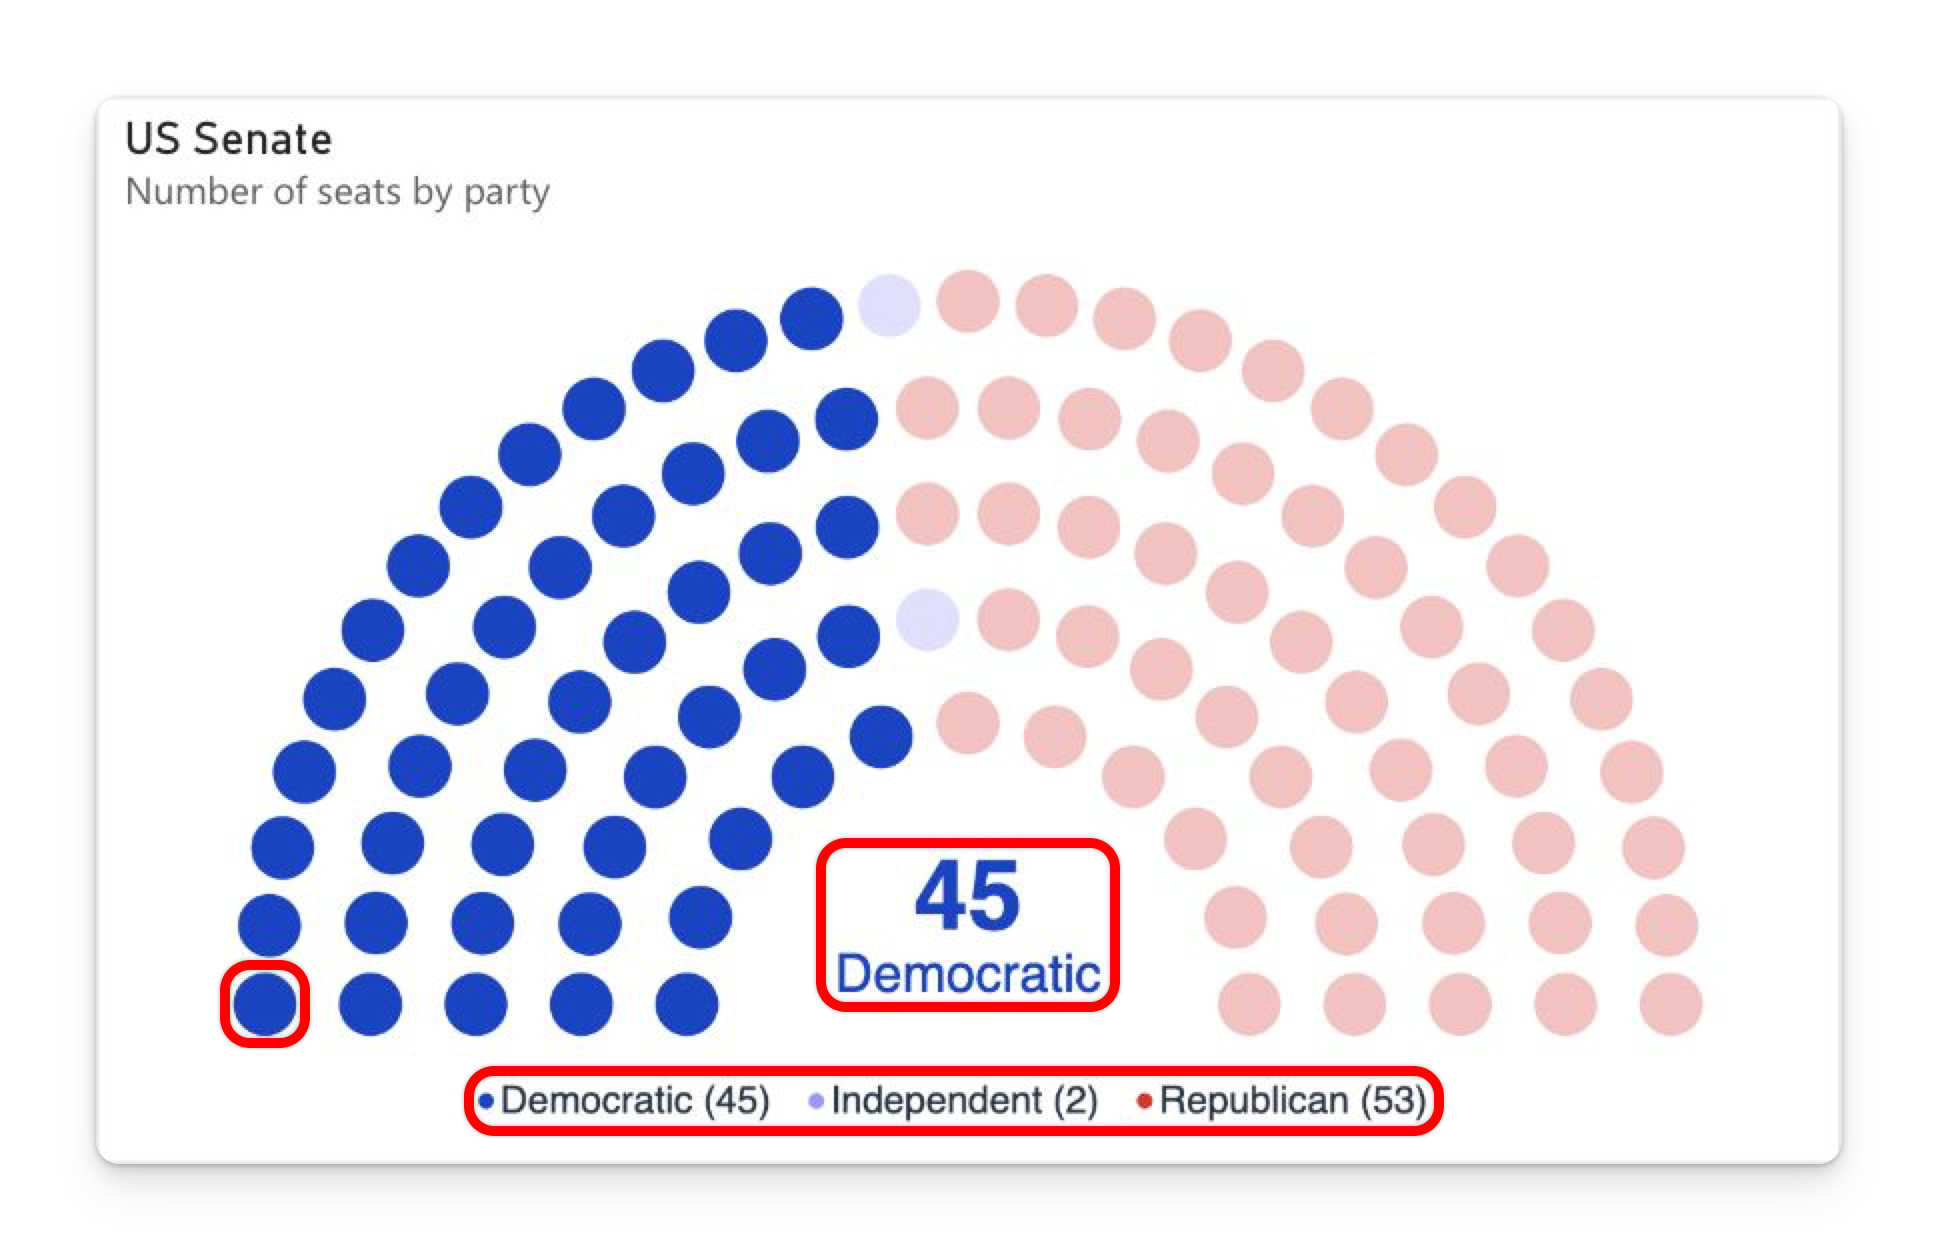
| Region | What it shows |
|---|---|
| Seat | One dot = one seat. Its colour is its party's colour. |
| Wedge | All of one party's seats, contiguous, spanning every row of the arch. |
| Rows | Concentric arcs of seats. The number of rows is calculated from the seat count and the arc — there is no row setting. |
| Centre label | The total number of seats, or the hovered/selected party's count in that party's colour. |
| Party name band | Sits under the centre total while a single party is hovered or selected. |
| Legend | The party list, positionable on any side, optionally showing each party's seat count, and clickable to filter. |
How to read it
- Each dot is one seat, not a proportion — the chart is countable, which is its whole point over a pie or a bar.
- Parties are contiguous around the arch, in the order set by Sort Order (or alphabetically if you don't set one). Neighbouring wedges are meant to imply political adjacency, so the order is worth setting deliberately.
- Seats fill laterally, not in rings — a party occupies a wedge across every row, so its size reads as an angle.
- The number in the middle is the total. Hover a party and it becomes that party's seat count, in that party's colour.
The visual does not draw a majority threshold marker. If a majority matters for your report — coalition scenarios, confidence votes — put the threshold in a card or a text box beside the chart (⌊total ÷ 2⌋ + 1), or use Sort Order to group a coalition's parties together so the block reads as one arc.
When to use it — and when not to
| Use a Parliament Chart when… | Use something else when… |
|---|---|
| Individual units are countable and meaningful — seats, members, delegates, votes, headcount. | The number is continuous (revenue, hours, temperature). Use a bar chart. |
| The audience expects the seating metaphor — elections, assemblies, boards, committees. | You have more than about 12 categories. Wedges get too thin to distinguish; group the tail into "Other". |
| Adjacency matters — coalitions, blocs, left-to-right ordering. | Adjacency is meaningless and precise comparison is the point. Use a sorted bar chart. |
| The total is a fixed, well-known number (650, 100, 720) that the reader wants to see. | You need to compare the same composition over time. Use a stacked bar or a Bump Chart. |
| You want a dot-count breakdown of any category — set the arc to 360° for a ring. | Your totals run into the tens of thousands. See the seat limit. |
Before you start
The Parliament Chart is free to try — every feature works during evaluation. To use it in a published report without an on-visual license notice, each editor and viewer needs a license (a 30-day free trial is available). See Licensing & support.
Next steps
- Getting started — install the visual and build your first chart in five steps.
- Shaping your data — party totals or one row per seat, and how to choose.
- Data fields — what each field well does, and exactly how your data is read.
- Sample data — copy-paste datasets to try both shapes right now.
- Layout & arc — the shape of the arch, seat ordering and the centre label.
- Legend & colours — party colours from three sources, and the legend.
- Interactivity — hover, selection, cross-filtering and tooltips.
- Use cases — worked examples beyond politics.
- Formatting reference — every setting, with its default.