Getting started
This page takes you from an empty report to a working parliament chart. No prior experience with custom visuals is required.
1. Add the visual to Power BI
The Parliament Chart is distributed through Microsoft AppSource, the marketplace built into Power BI. You can view the listing here: ChartPad Parliament Chart on AppSource.
- In Power BI Desktop (or the Power BI service), open the report you want to add the visual to.
- In the Visualizations pane, select the ⋯ (Get more visuals) button.
- Search for Parliament and choose Parliament Chart by ChartPad.
- Select Add. The Parliament Chart icon appears at the bottom of your Visualizations pane.
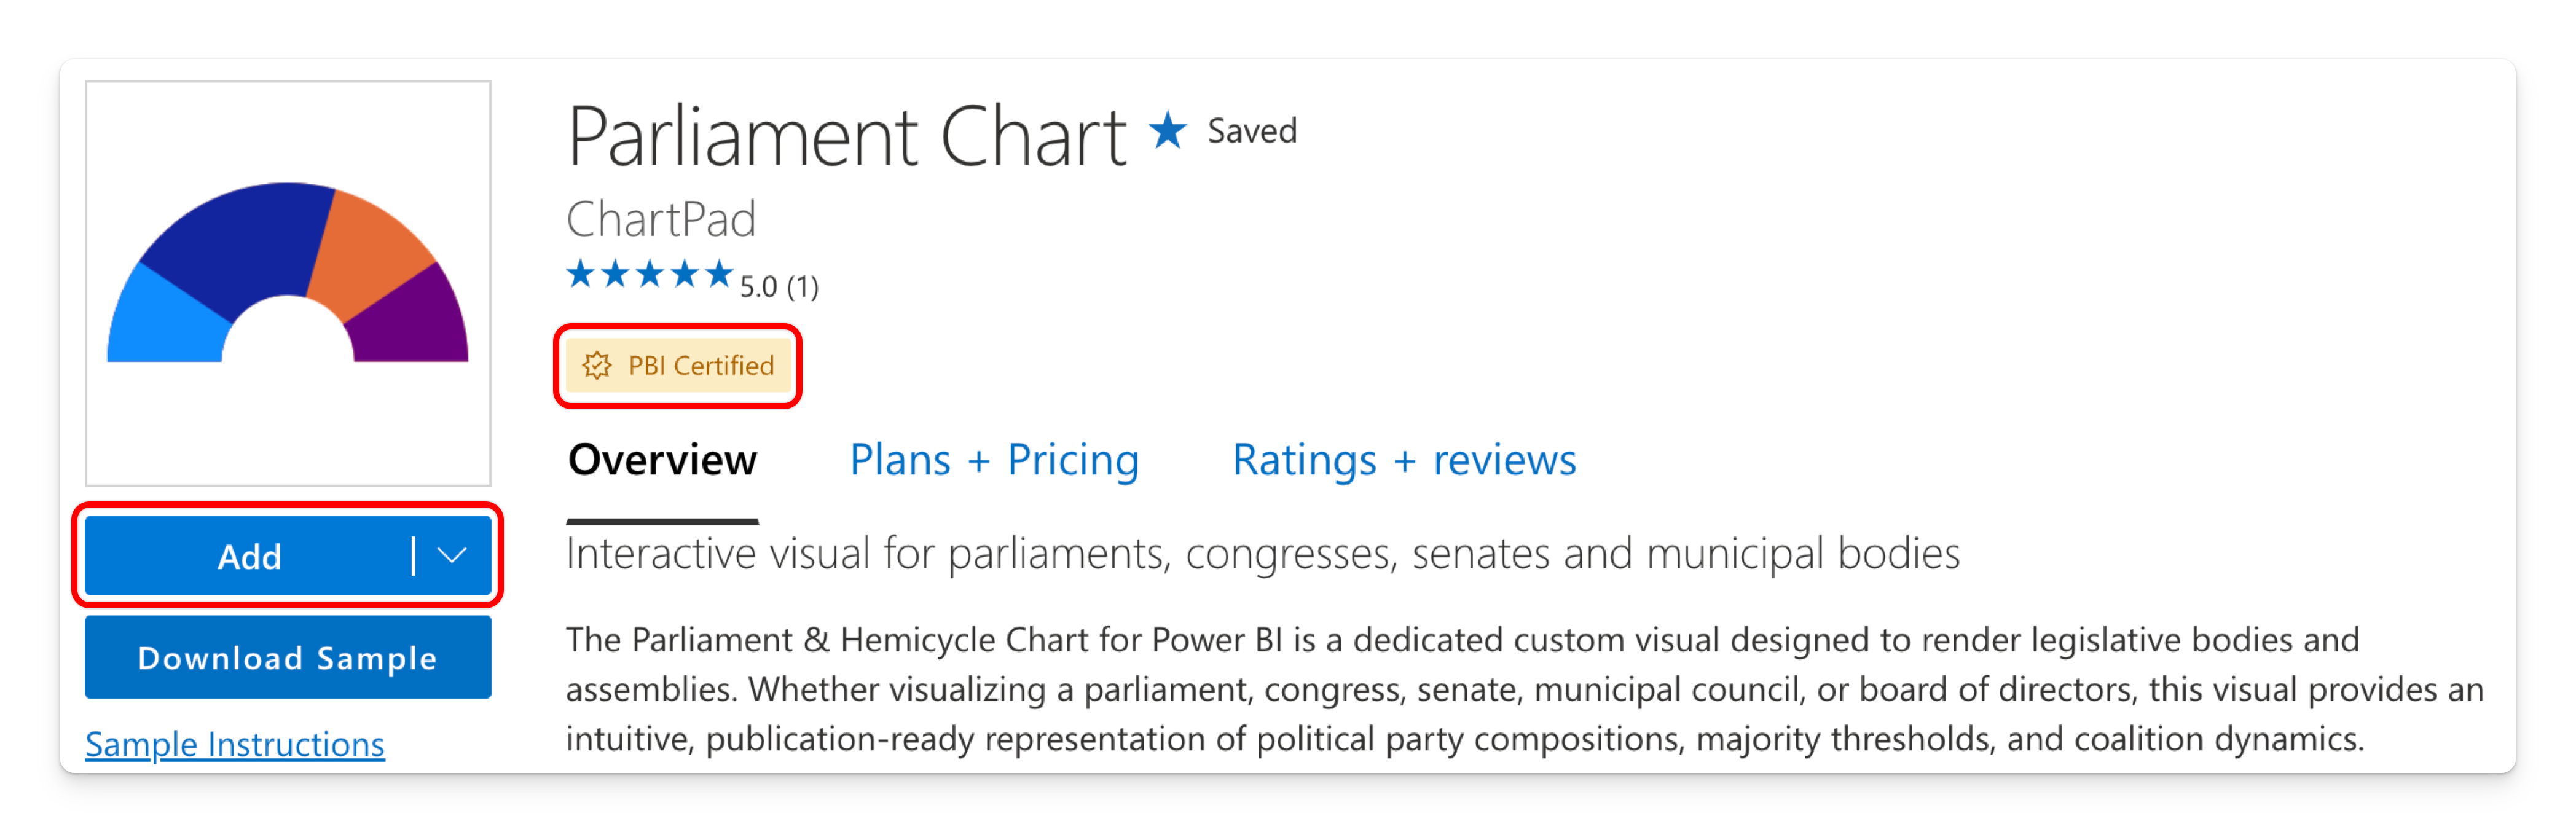
The Parliament Chart is a Microsoft-certified visual, so it shows a Certified badge in Power BI. When browsing "Get more visuals", turn on the Power BI Certified filter to find it quickly.
Your organization may restrict AppSource. If you can't add visuals, ask your Power BI administrator to allow the ChartPad Parliament Chart, or to import it as an organizational visual.
Certified by Microsoft
The ChartPad Parliament Chart is a Microsoft-certified Power BI visual. Certification means Microsoft has reviewed and tested the visual's code and confirmed that it does not access any external services or resources — your data stays inside Power BI and never leaves your tenant.
For report editors, that brings four practical benefits:
- Safe for enterprise and regulated environments — nothing is sent to an outside service, so the visual suits organizations with strict data-governance rules.
- Export to PowerPoint and PDF — reports using the Parliament Chart export correctly. The visual reports its render status to Power BI, so exports wait for the arch to finish drawing before capturing it.
- Email subscriptions — the visual renders in the images delivered when users subscribe to report pages.
- Easy to find — use the Power BI Certified filter in "Get more visuals".
Certification also explains one design choice you'll meet later: direct license keys are verified offline, inside the visual, with no network call (Licensing).
2. Place it on the canvas
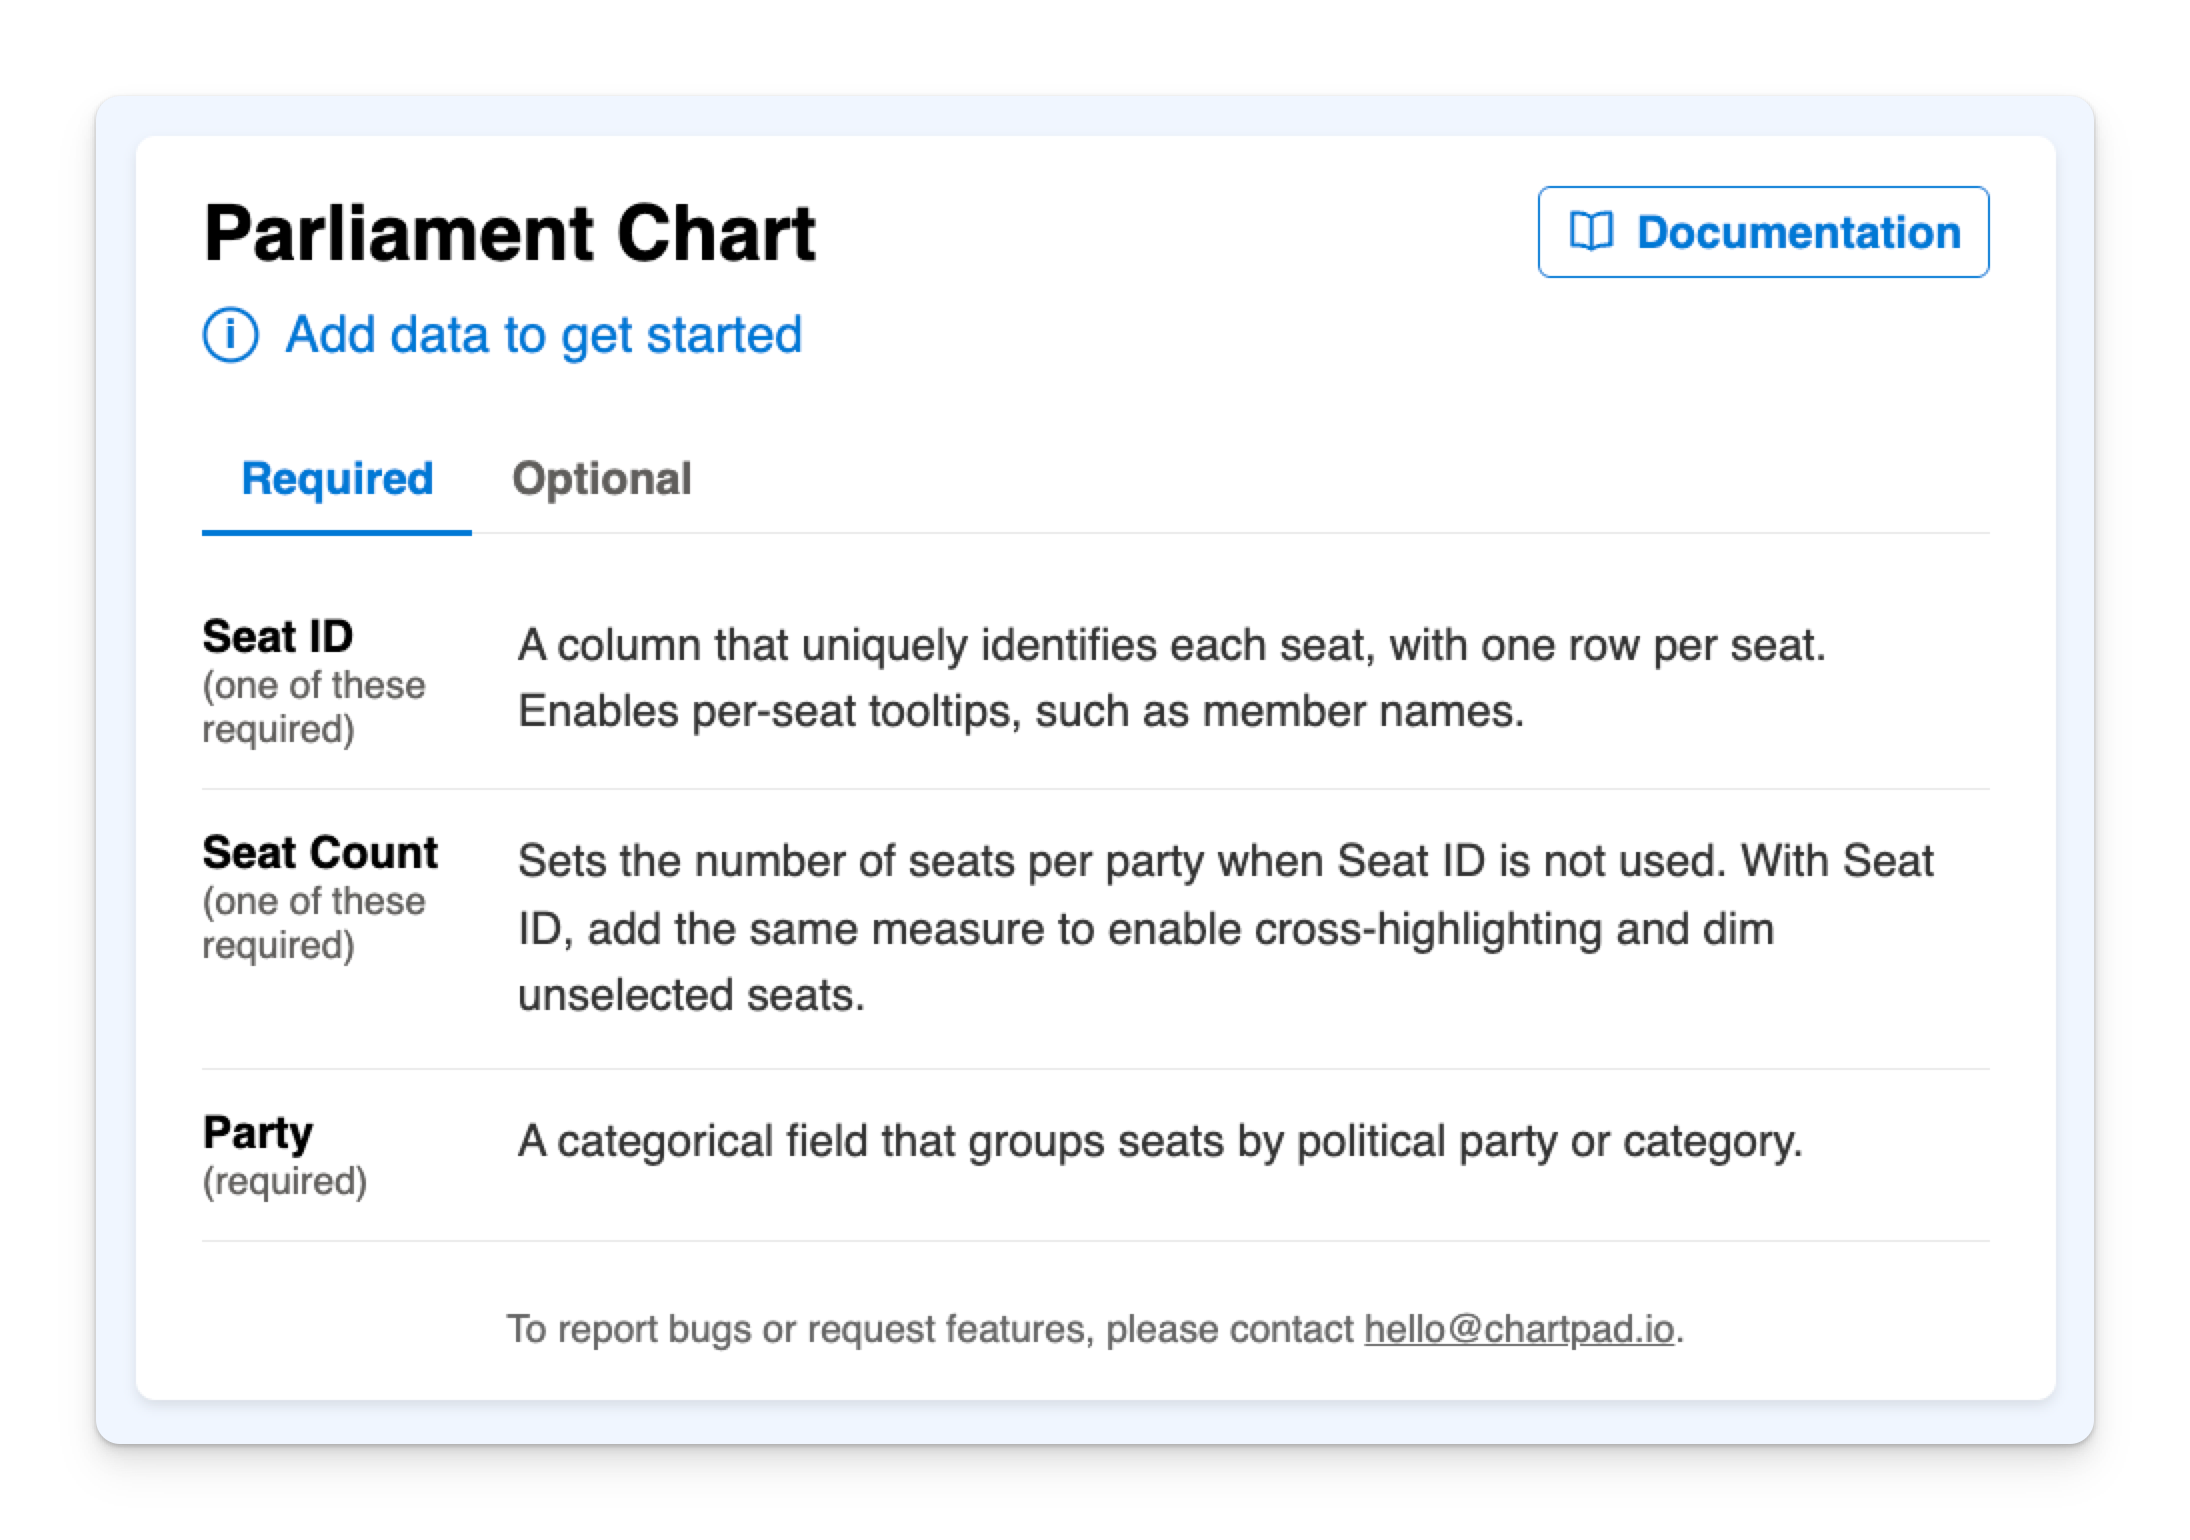
Select the Parliament Chart icon in the Visualizations pane. An empty visual is added to the canvas, showing a landing page with a Required and an Optional tab listing every field you can bind, and a Documentation button that opens this site.
3. Prepare your data
The Parliament Chart accepts two different data shapes, and the one you pick decides which fields you bind. Both are fully supported — pick by what your model already has.
Option A — party totals (one row per party)
The common case. One row per party, with a number of seats.
| Party | Seats |
|---|---|
| Progressive Alliance | 41 |
| Civic Union | 33 |
| Green List | 18 |
| Independents | 8 |
Option B — one row per seat
Use this when each seat is a real thing you want to name — a member, a delegate, a desk.
| Seat ID | Member | Party |
|---|---|---|
| S-001 | A. Whitcombe | Progressive Alliance |
| S-002 | R. Delgado | Progressive Alliance |
| S-003 | M. Osei | Civic Union |
| S-004 | K. Lindqvist | Green List |
The trade-off in one line: party totals are simpler and refresh faster; one row per seat lets every seat carry its own tooltip. Full comparison in Shaping your data.
The visual works out rows, seat size, spacing and position for you from the arc and the number of seats. There is nothing to pre-compute — no coordinates, no row numbers, no angles.
4. Bind the fields
With the visual selected, drag your columns into these field wells.
If you're using party totals (Option A):
- Party ←
Party— one wedge and one legend entry per distinct value - Seat Count ←
Seats— how many seats each party gets
If you're using one row per seat (Option B):
- Party ←
Party - Seat ID ←
Seat ID— one seat is drawn per distinct value - Tooltips ←
Member— so hovering a seat names the person sitting in it
The landing page disappears and the arch renders as soon as Party plus one of Seat Count or Seat ID is populated.
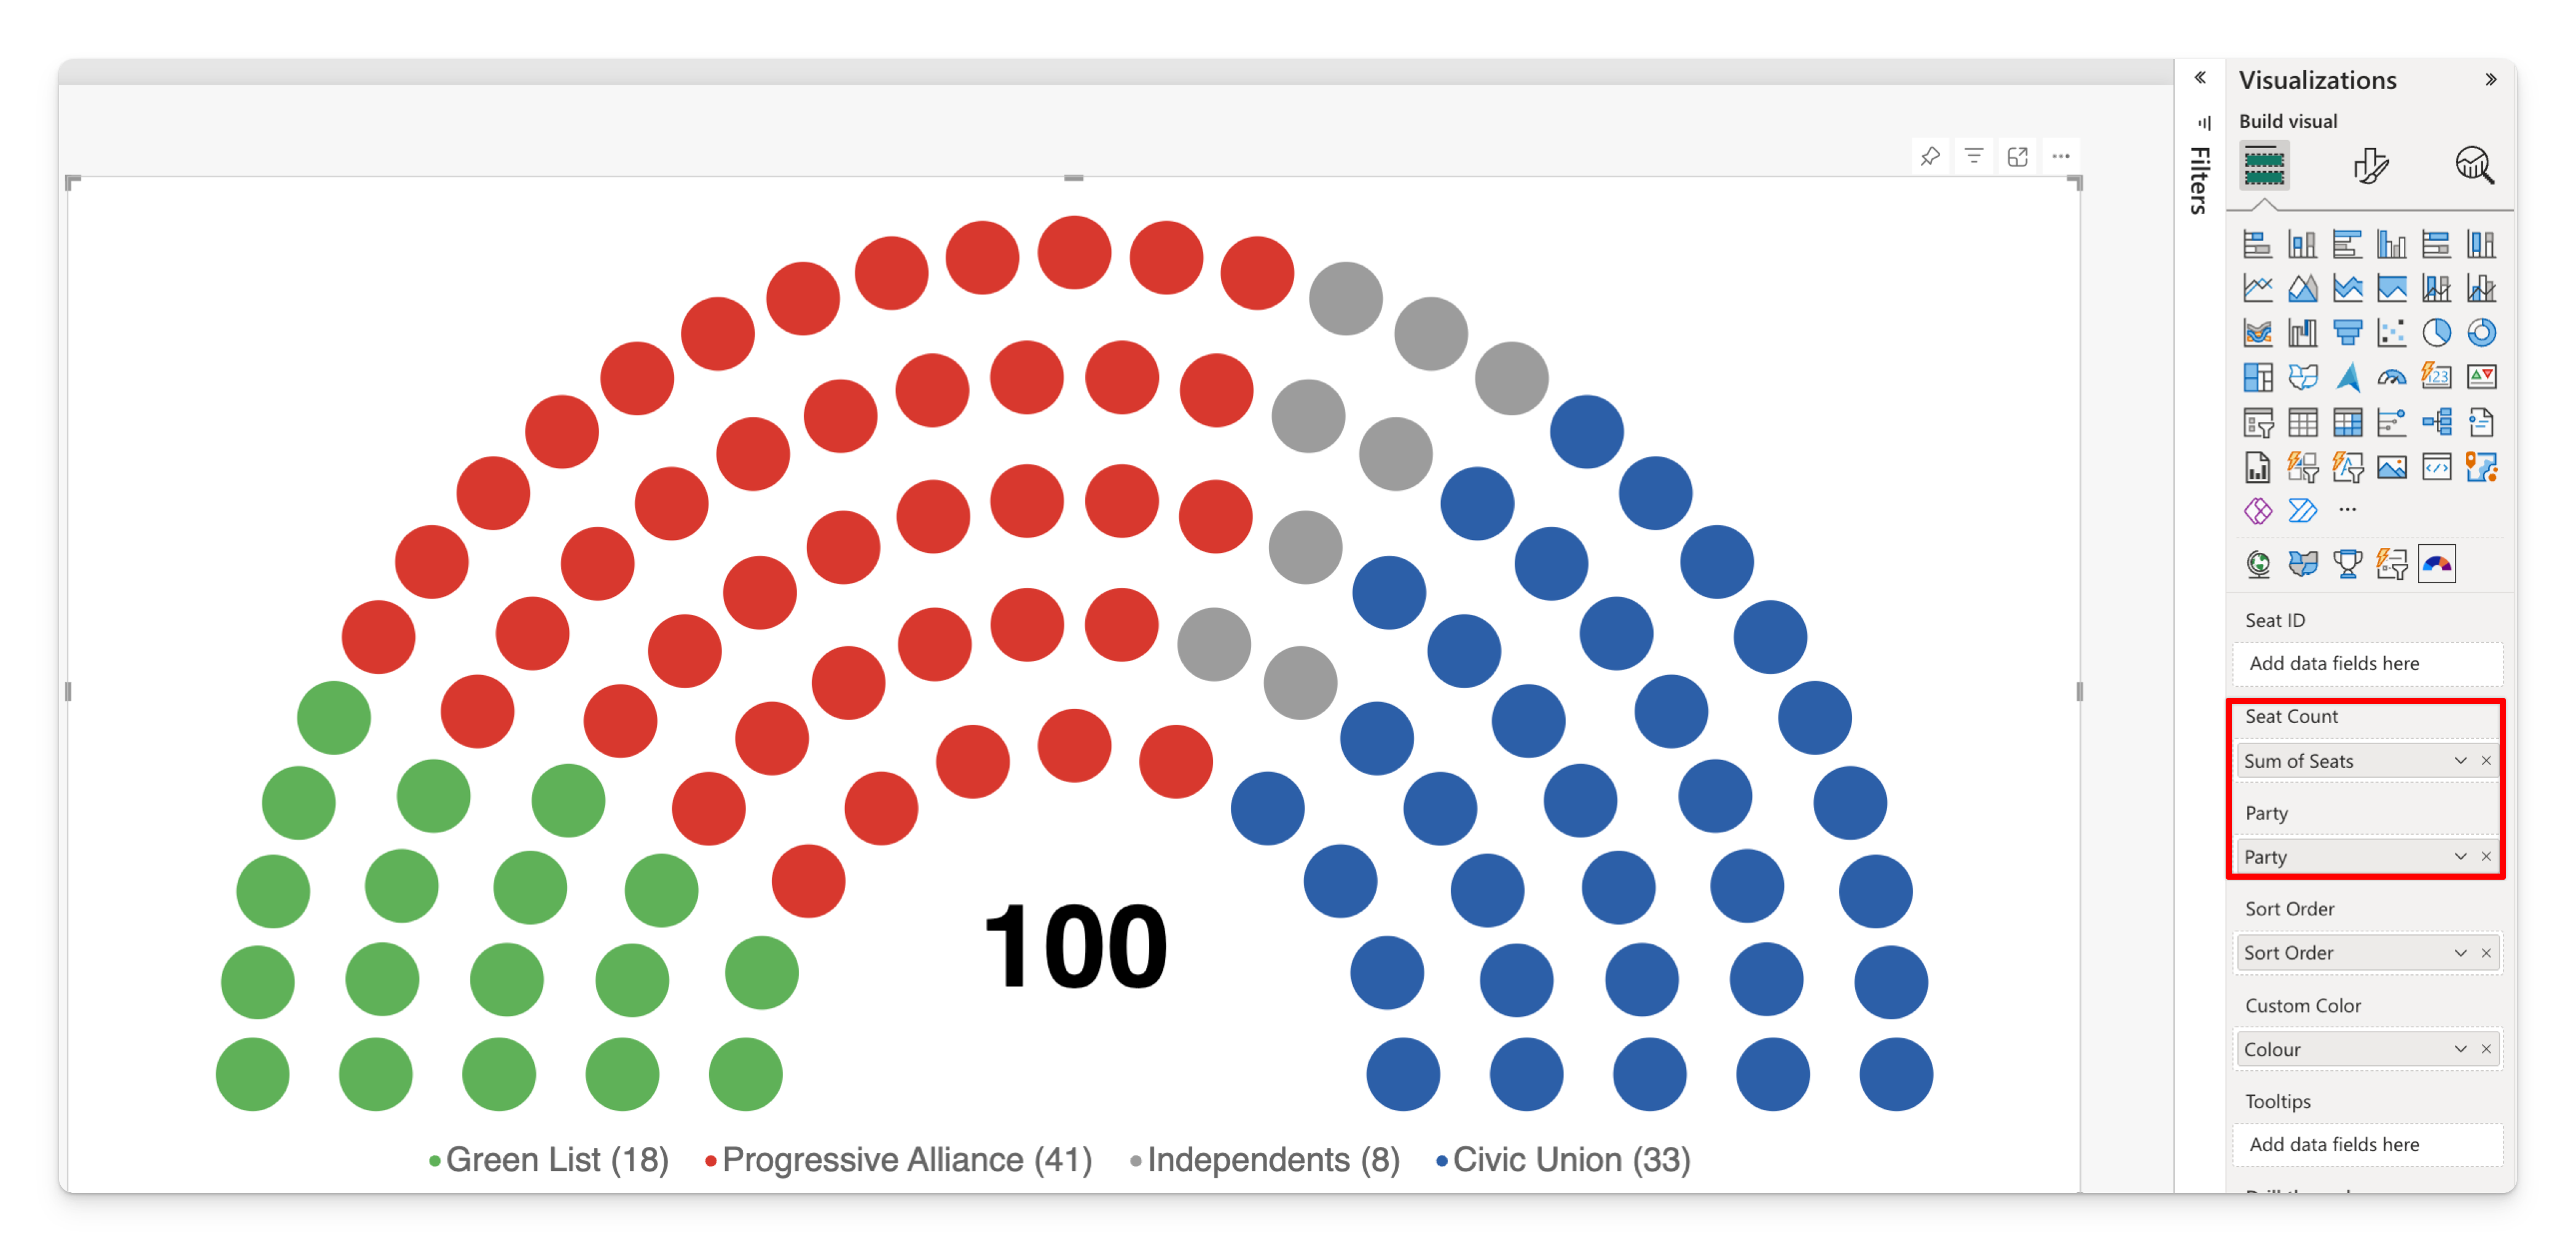
Seat Count is a measure well, so dropping a plain column makes Power BI aggregate it — Sum by default. That's usually right. If you drop a text column there by mistake, the visual tells you so rather than going blank: see Seat Count must be a number.
5. Set the order of the parties
By default parties are placed around the arch alphabetically, which is almost never what you want. Add a numeric Sort Order column to your model — 1 for the leftmost party, 2 for the next, and so on — and drag it into the Sort Order well.
| Party | Seats | Sort Order |
|---|---|---|
| Green List | 18 | 1 |
| Progressive Alliance | 41 | 2 |
| Independents | 8 | 3 |
| Civic Union | 33 | 4 |
The lowest value sits at the left end of the arch, and the legend follows the same order.
| Alphabetical | Custom Sort Order |
|---|---|
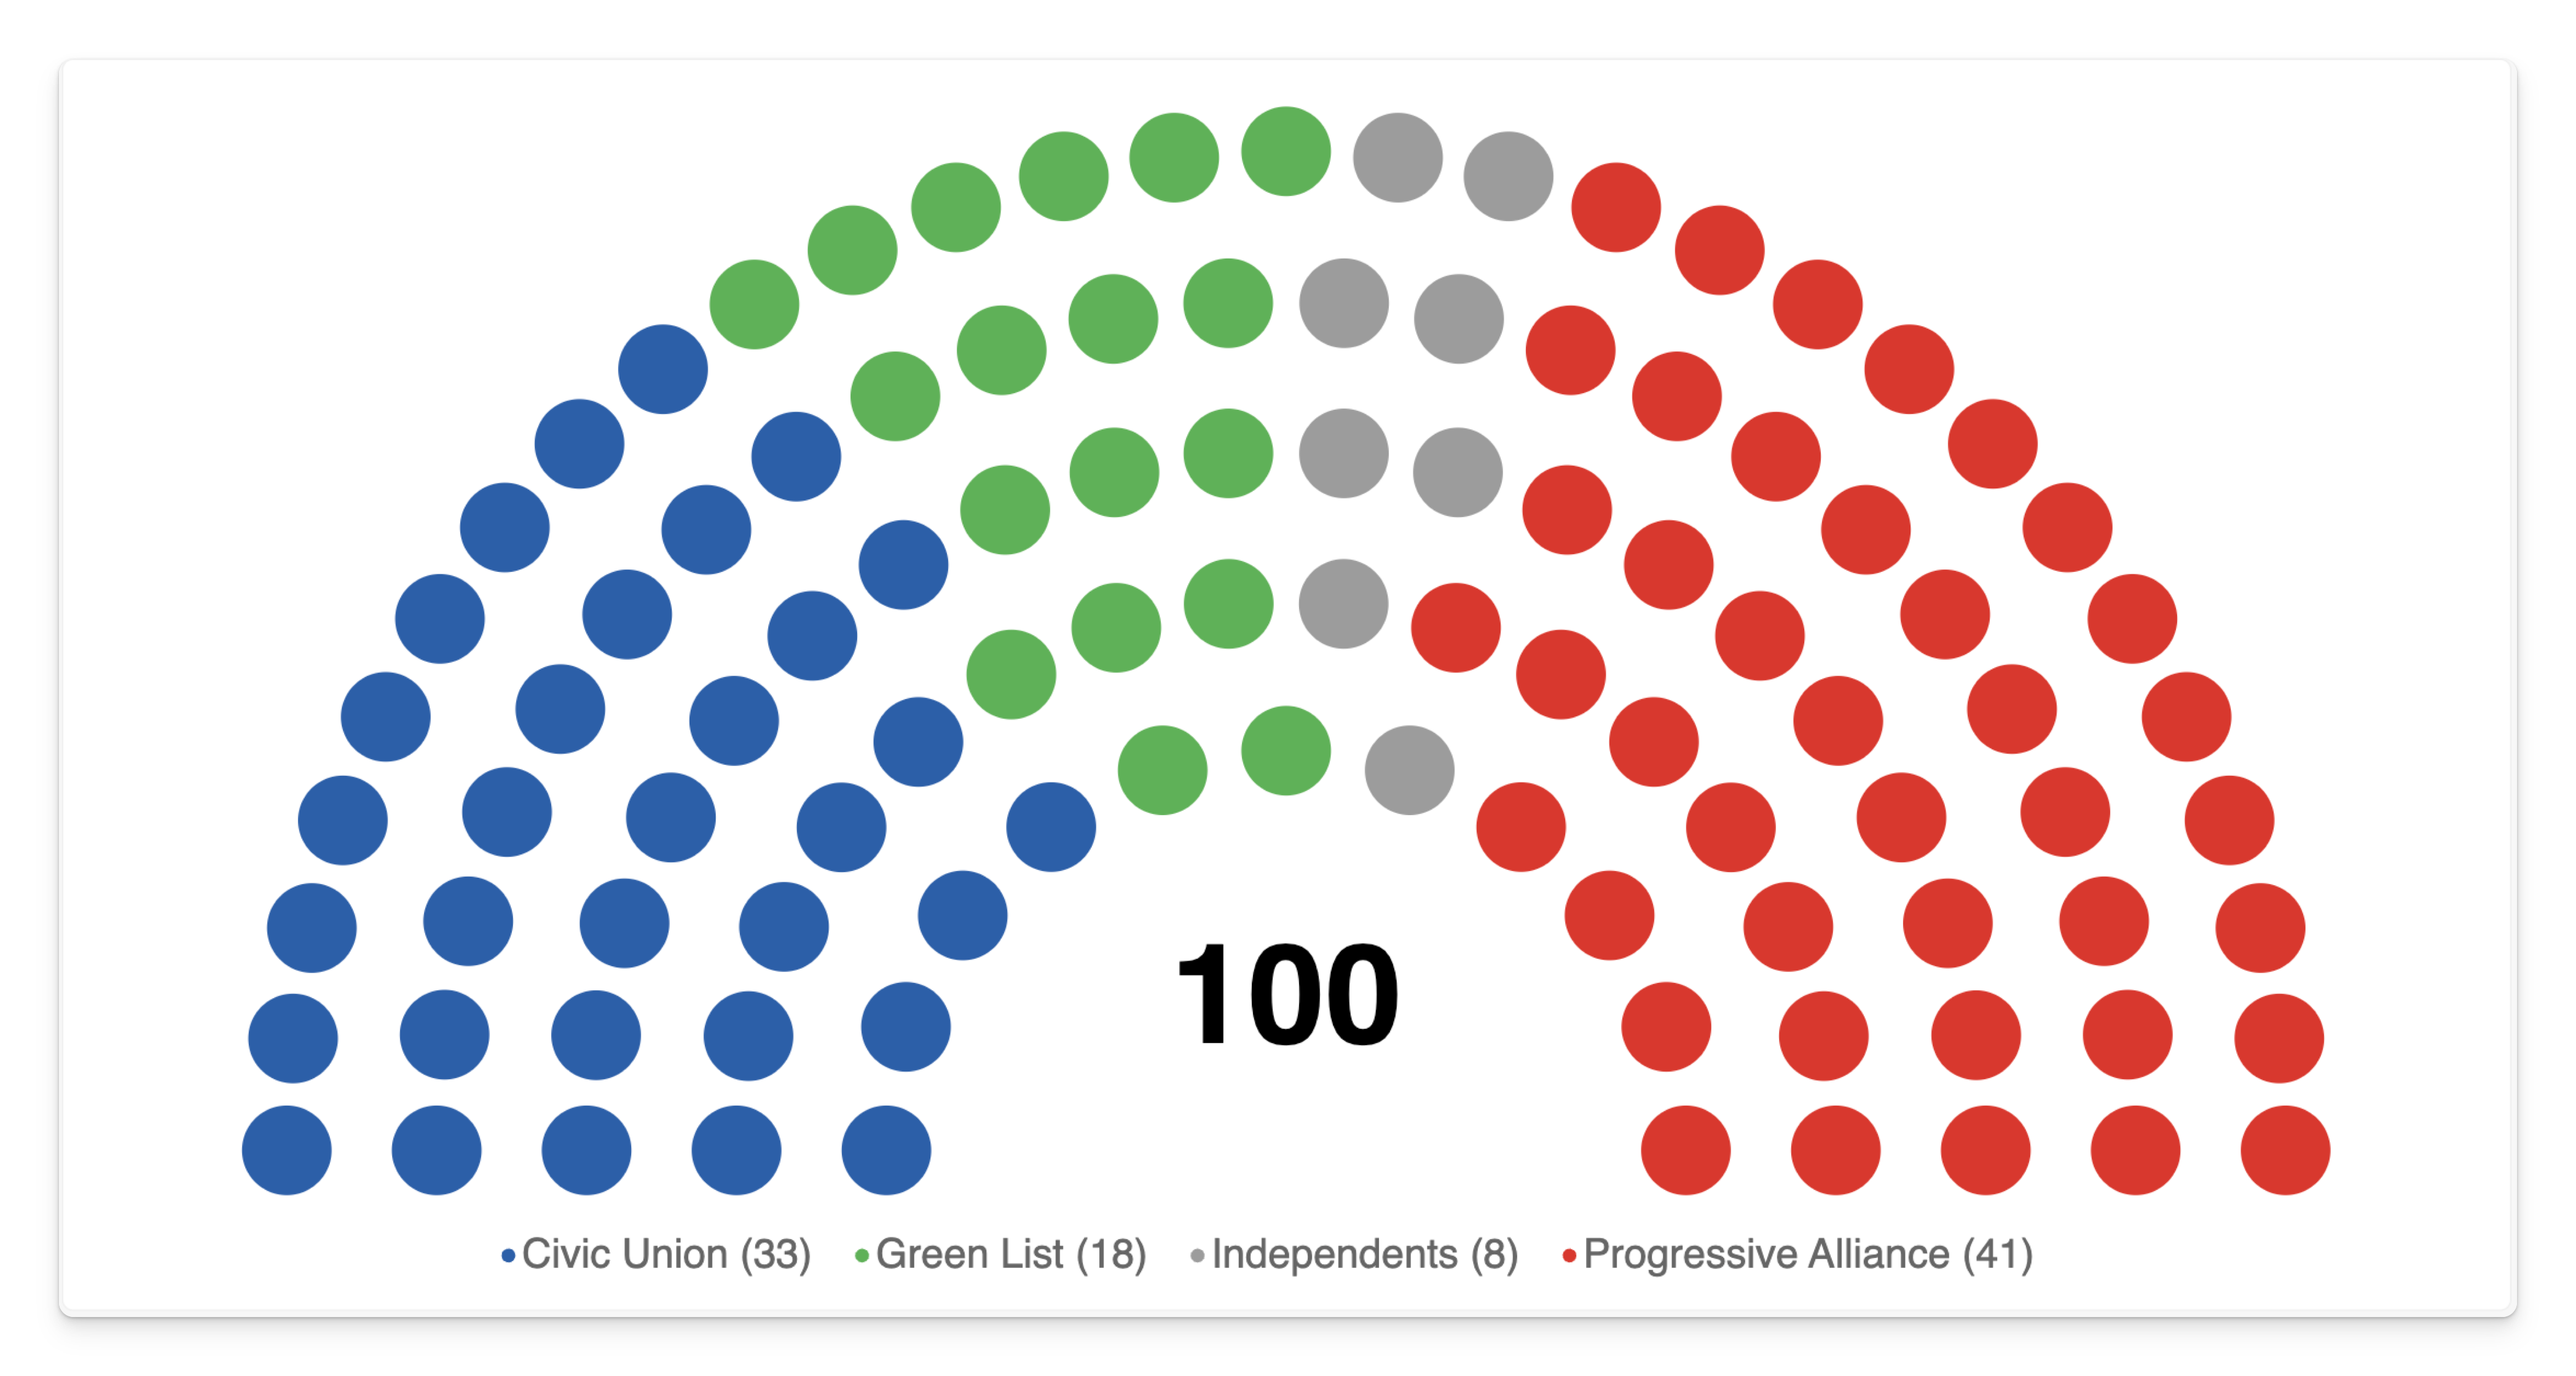 | 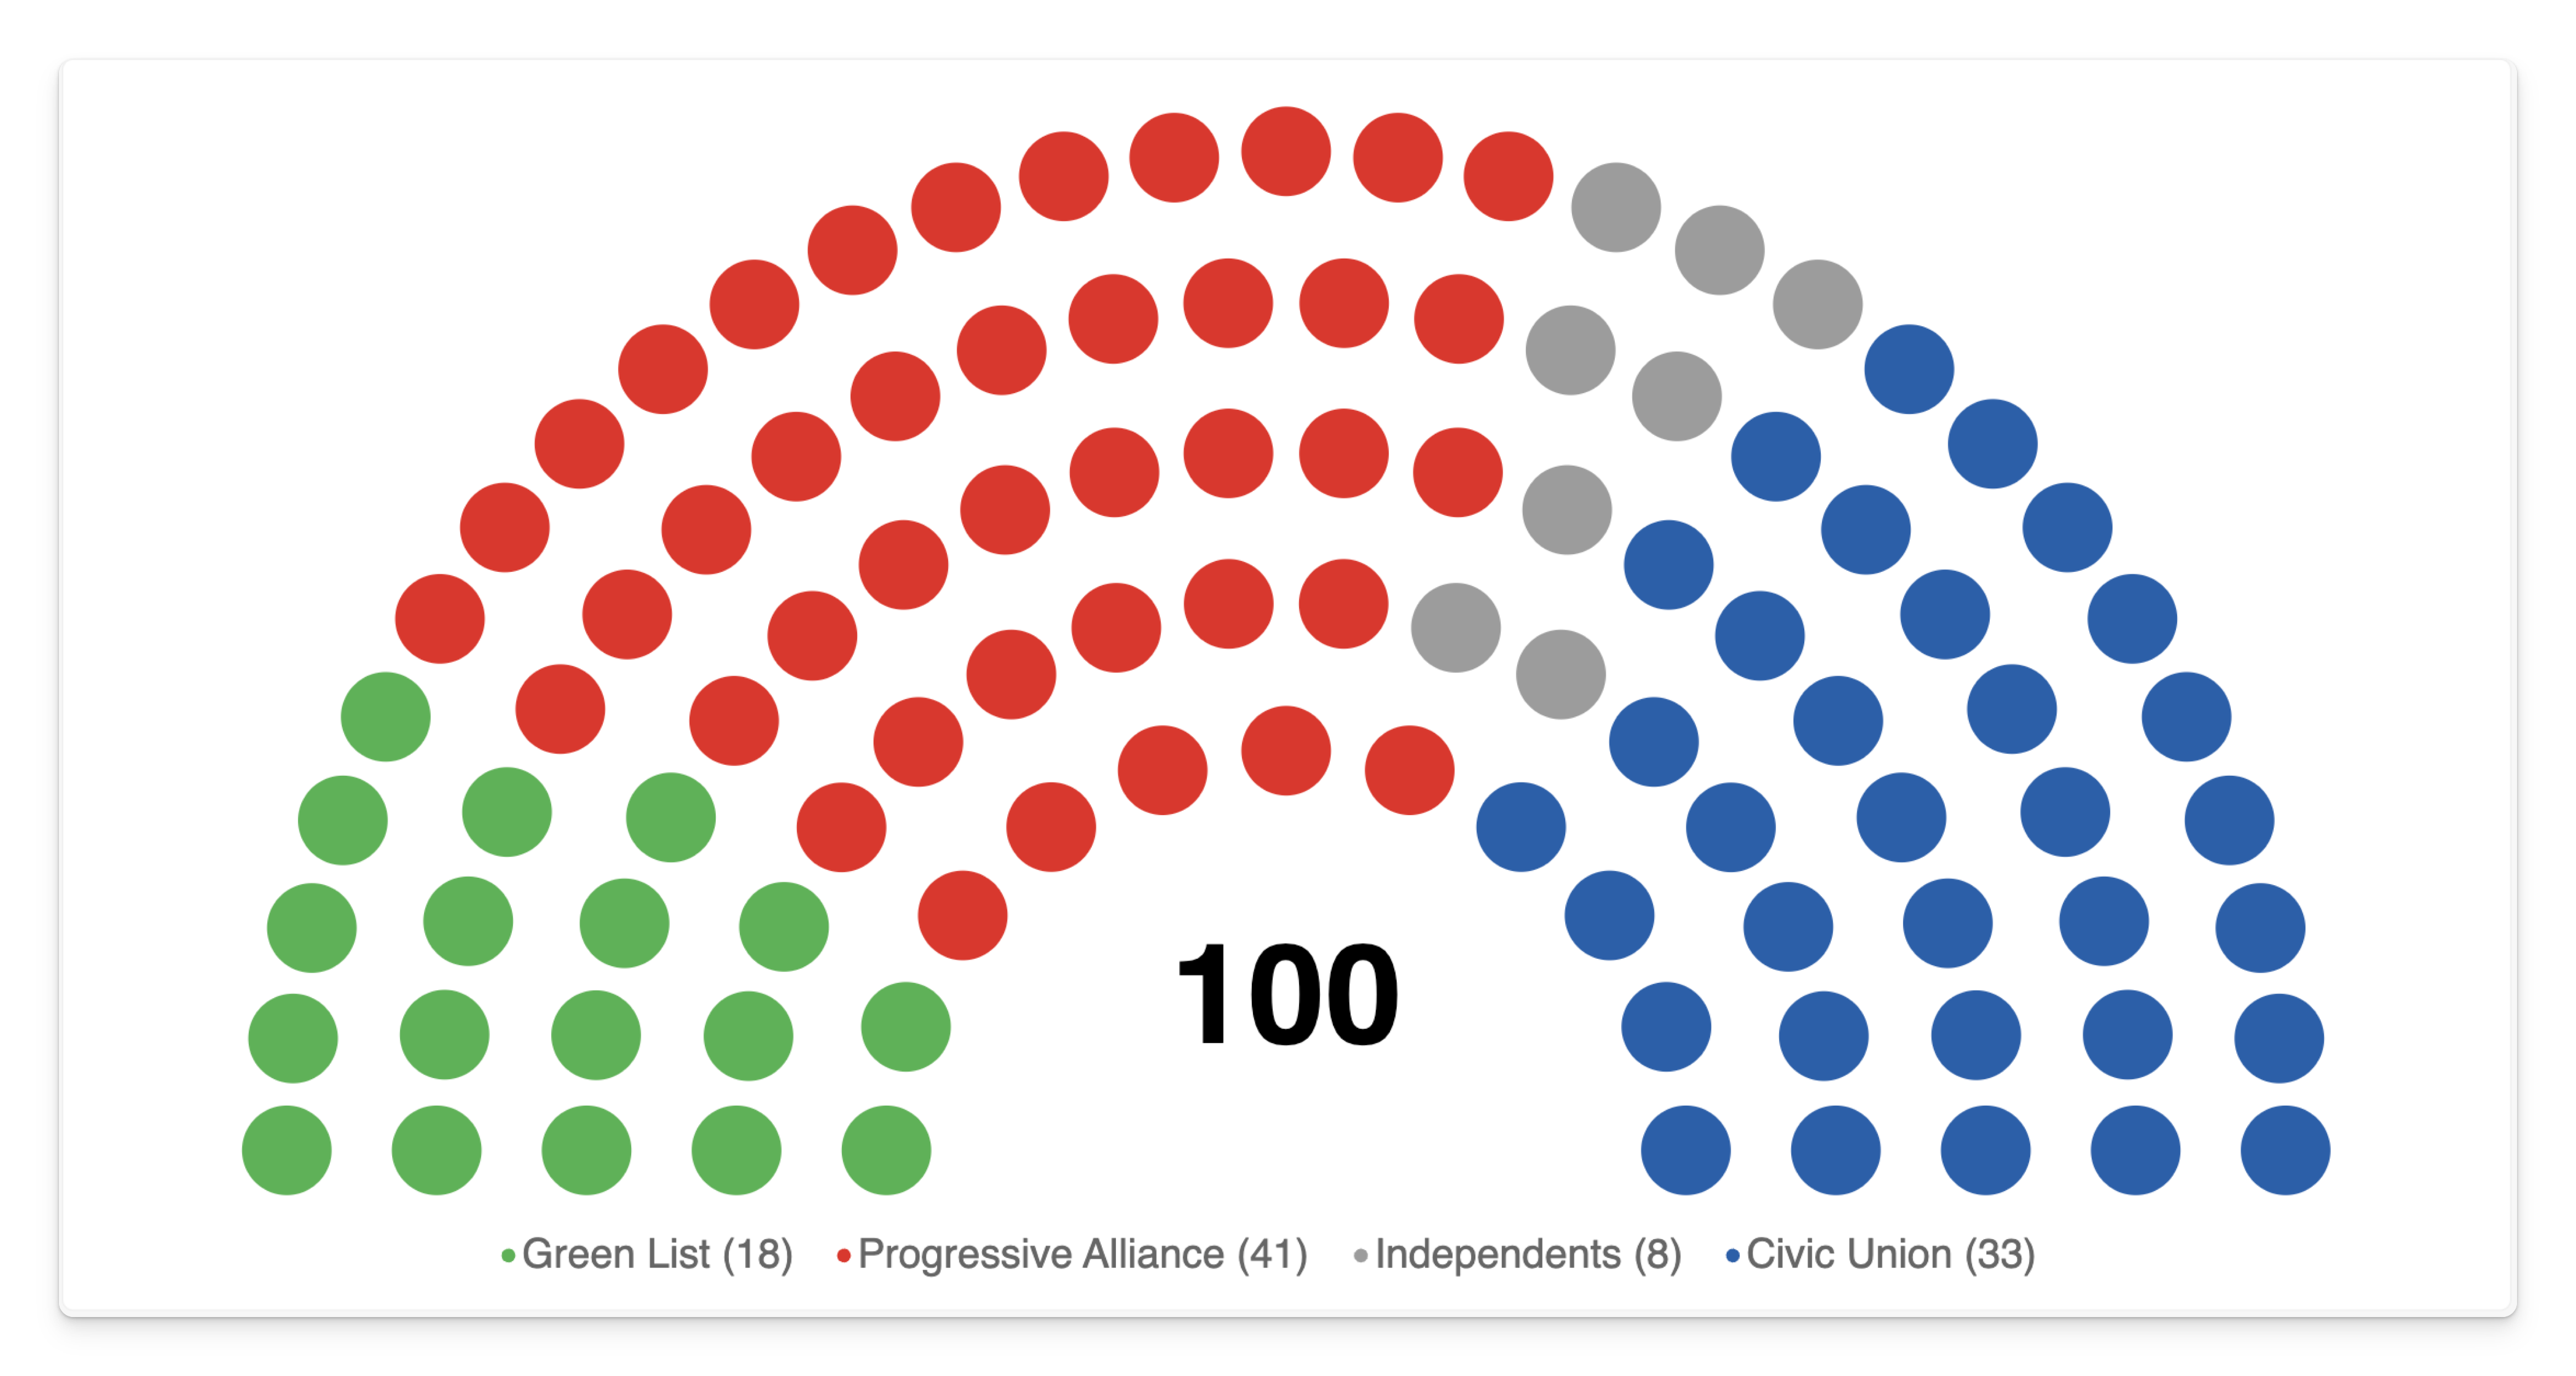 |
Both charts use the same 100 seats and four parties. The Sort Order values from the table are applied on the right.
This is the single most impactful thing you can set, and it's covered in full in Seat and party ordering.
6. Finish the look
Three quick wins for a first chart:
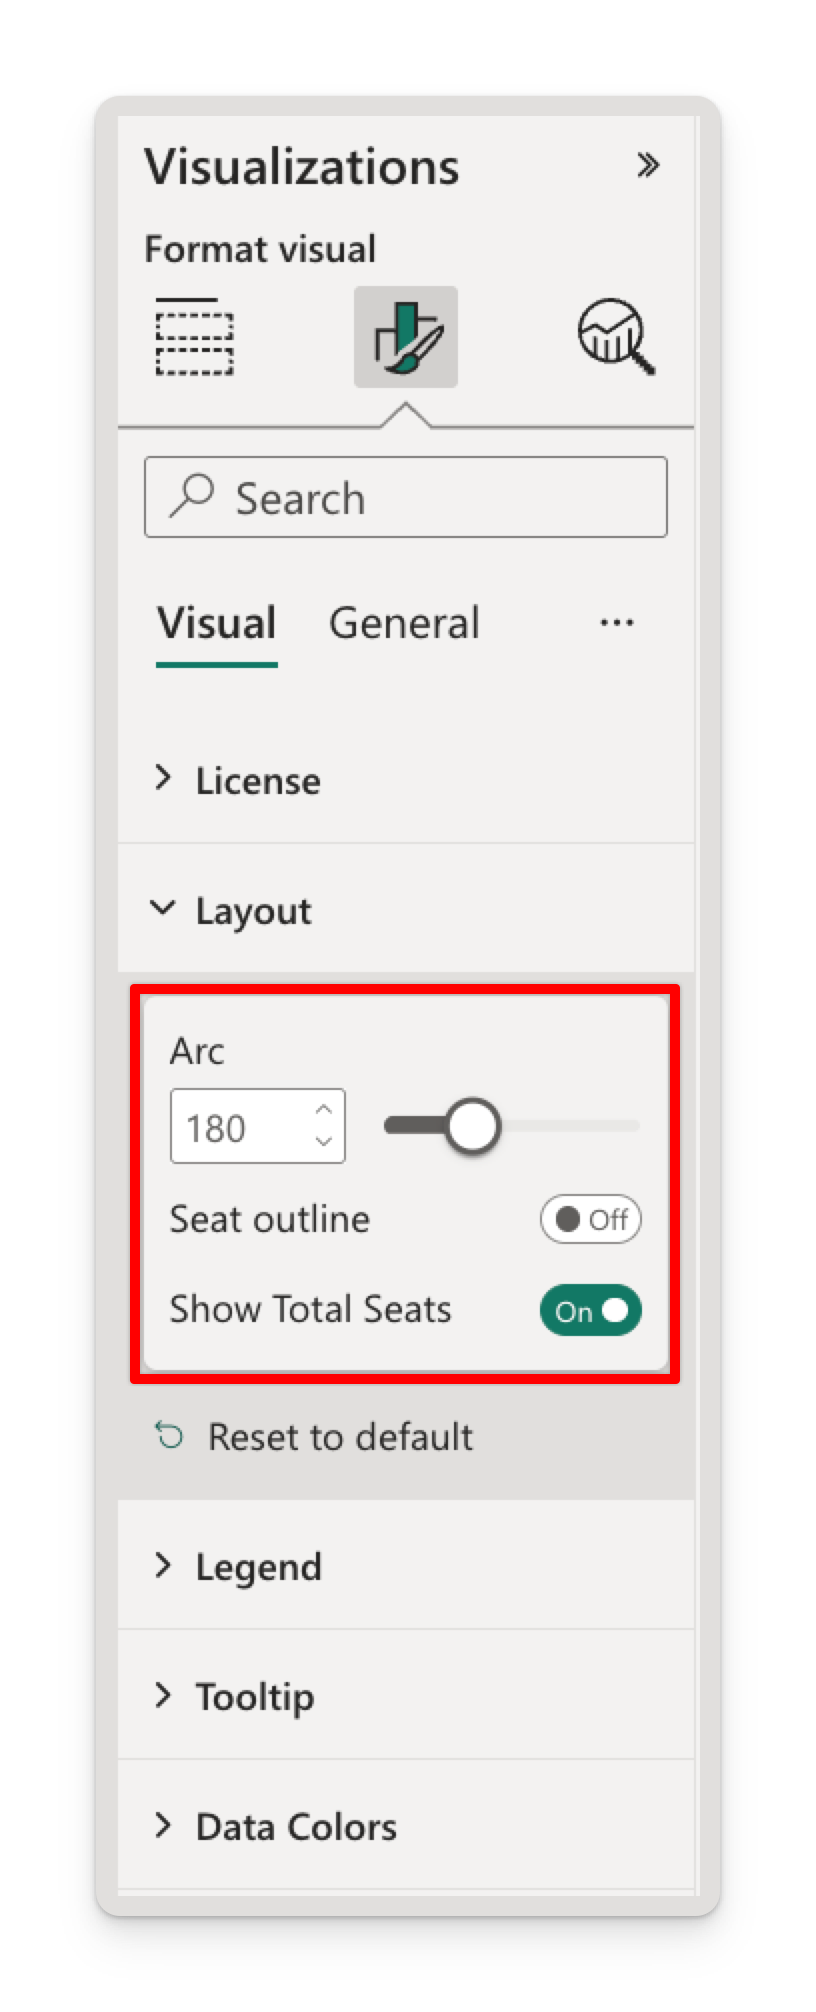
- Format → Layout → Arc — 180° is the classic hemicycle. Drag it down to ~150° for a taller, more compact arch, or all the way to 360° for a ring.
- Format → Legend → Seat counts — appends each party's total to its legend entry, so the legend doubles as a results table.
- Format → Data Colors — set each party's real colour. Or, if your model already holds hex codes, bind them to the Custom Color well instead — see Colours.
You're set
From here:
- Choose and shape your data → Shaping your data
- What every field well does → Data fields
- Datasets you can paste straight in → Sample data
- Arc, ordering and the centre label → Layout & arc
- Party colours and the legend → Legend & colours
- Hover, selection and tooltips → Interactivity
- Worked examples → Use cases