Data fields
The Parliament Chart is driven entirely by the fields you drag into its wells. This page covers every field — what it does, whether it's required, what it accepts — and exactly how your data is read.
For the bigger question of which fields to bind, start with Shaping your data.
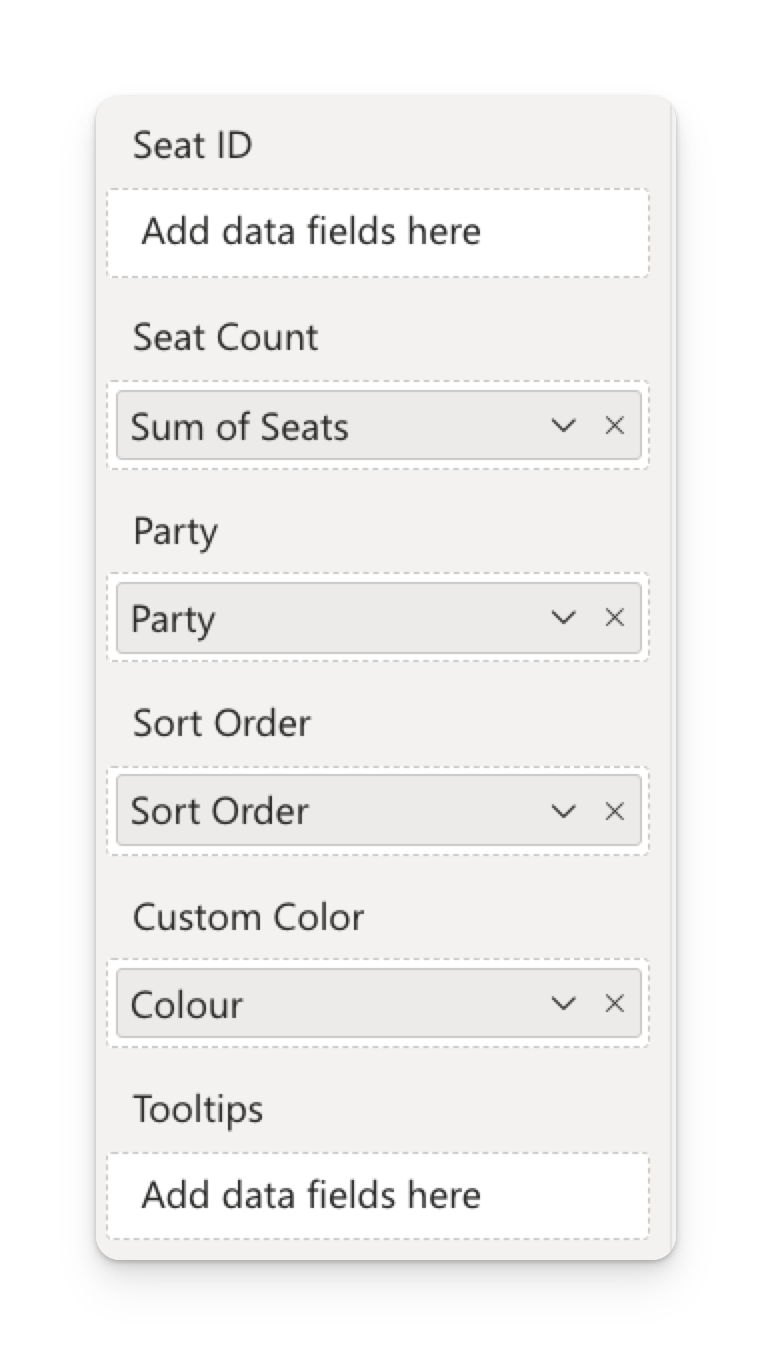
Field summary
| Field | Required | Accepts | Max columns | What it does |
|---|---|---|---|---|
| Party | Yes | Column (text) | 1 | One wedge, one legend entry and one colour picker per distinct value. |
| Seat Count | One of these two | Measure or aggregated column (numeric) | 1 | How many seats each party gets. |
| Seat ID | One of these two | Column (text or number) | 1 | One seat per distinct value — one row per seat. |
| Sort Order | No | Column (numeric) | 1 | The order parties are placed around the arch, left to right. |
| Custom Color | No | Column (text, hex codes) | 1 | Party colours taken straight from your model. |
| Tooltips | No | Columns | Unlimited | Extra values shown when hovering a seat. |
The visual shows its landing page until Party and at least one of Seat Count or Seat ID are bound.
Party
The thing being counted: a political party, a group, a status, a department, a vote outcome.
- Accepts a text column. Each distinct value becomes one contiguous wedge of seats, one legend entry, and one colour picker under Format → Data Colors.
- Parties are placed round the arch in Sort Order, or alphabetically if you don't bind one.
- A party whose seat count comes out as zero or blank is drawn nowhere and gets no legend entry. It doesn't leave a gap.
- Keep the count reasonable: past about 12 parties the wedges get too thin to tell apart, and the legend starts to scroll. Group the long tail into an "Other" category in your model.
The party name is used verbatim in the legend, in the tooltip and in the band under the centre total. Rename in the model (or in the field well) rather than accepting Party_Code_2.
Seat Count
The number of seats a party holds. This is a measure well.
- Bind a measure, or a column that Power BI aggregates for you — Sum is the default and is almost always what you want.
- Values are rounded to the nearest whole seat.
41.6draws 42 seats. - Negative values are treated as zero. A party can't hold minus three seats.
- Blank is fine — for example when a slicer empties one party. That party simply isn't drawn.
- The total across all parties is capped; see The seat limit.
What it does depends on Seat ID
| Seat ID bound? | What Seat Count does |
|---|---|
| No | Drives the chart. Each party gets exactly as many seats as its measure value. |
| Yes | Ignored for sizing — the seat count comes from the rows instead. But it still enables cross-highlight dimming; see below. |
Even when you're working one-row-per-seat, adding a measure such as Seats = COUNTROWS(Members) to Seat Count is worth doing: it's what lets the visual dim the seats that another visual's selection excludes. Without it, cross-highlighting from elsewhere on the page leaves the arch unchanged. See Being filtered by other visuals.
Dropping a text column into Seat Count — a Seat ID field aggregated with First, most often — produces a clear message on the canvas rather than a blank visual. Change the aggregation to Count, or bind a real measure. See Seat Count must be a number.
Seat ID
A column that uniquely identifies each seat, with one row per seat in your model. Binding it switches the visual into per-seat mode.
- Accepts text or numbers —
S-001,A14,1,2,3. - Each distinct value produces exactly one seat.
- With Seat ID bound, each seat can carry its own Tooltips values — a member name, a constituency, a term end date.
Not just within a party. If two parties both contain a seat numbered 1, the duplicate is dropped and your chart comes up short. Use a genuinely unique key — a member ID, or a composite like PartyCode & "-" & SeatNumber — rather than a per-party sequence.
- Blank Seat ID values are grouped together by Power BI into a single seat. Filter them out, or fix them in the model.
- Seat ID is not a seat position. It doesn't decide where a seat sits in the arch — ordering does that.
Sort Order
A numeric column deciding the order parties are placed around the arch — the political left-to-right axis, a seniority order, a severity order.
- The lowest value sits at the left end of the arch. Values ascend clockwise round to the right end.
- The legend follows the same order, so chart and legend stay in step.
- Values don't need to be consecutive.
10, 20, 30works, and leaves room to insert a party later. - Only the lowest value found for a party is used, so it's safe to put the sort key on a per-seat table where it repeats.
- Without Sort Order, parties are ordered alphabetically by name.
Parties with no Sort Order value fall back to alphabetical placement relative to the others, which interleaves them unpredictably. If you bind the field, populate it for every party — including "Other" and "Independent".
Worked example and the common alternatives are in Seat and party ordering.
Custom Color
A text column holding a colour per party, so party colours live in your model instead of in each report.
- Values must be CSS colour strings —
#DC241Fis the safe form. Three-digit hex (#F00) and named colours (red) also work. - The value is read per party; put the same colour on every row of a party.
- Custom Color overrides the Format pane. While it's bound and populated, the per-party colour pickers under Data Colors have no effect for those parties.
Full detail, including the three-tier colour resolution, is in Party colours.
Tooltips
Extra columns shown when a seat is hovered, beneath the party row.
- Accepts columns, and as many as you like. This is a grouping well, so measures can't be dropped here — see the tip below.
- Values respect each column's model format string — dates, currencies, decimals — and the viewer's locale.
- Column names are used as the labels, so rename in the model (or in the field well) to control the wording.
- Fields appear in the order you drop them.
How the values are matched to seats depends on your data shape:
| Shape | What each seat shows |
|---|---|
| One row per seat | That seat's own values. This is the reason to use per-seat mode: hovering shows the member's name. |
| Party totals | The value for the group the seat belongs to. A tooltip field splits each party into sub-groups, and each sub-group's seats carry its values. |
The Tooltips well is categorical, so a measure can't go in it. To surface calculated values on hover, build a report-page tooltip — the Parliament Chart supports them, and a tooltip page can hold any measures and visuals you like.
Dropping one column into both Seat ID and Tooltips can stop it appearing in the tooltip — Power BI sends it as a single column carrying both roles, and the visual reads it as the seat key. Use a duplicate column, or a different field, for the tooltip.
See Tooltips for what the standard rows contain.
Next steps
- Shaping your data — the two shapes side by side, and how to convert between them.
- Sample data — datasets you can paste straight into Power BI.
- Layout & arc — turning bound fields into an arch.