Shaping your data
The Parliament Chart reads two different data shapes, and choosing between them is the first real decision you'll make. Both are fully supported — there is no "proper" one — and the visual switches between them automatically based on which fields you bind.
The two shapes at a glance
| Party totals | One row per seat | |
|---|---|---|
| Your table has | One row per party | One row per seat |
| Bind | Party + Seat Count | Party + Seat ID |
| Seats come from | The measure value | The number of rows |
| Tooltips show | The party (plus any grouping fields) | That seat's own values — a member name, a constituency |
| Rows sent to the visual | A handful | One per seat |
| Best for | Election results, poll projections, any total you already have | Membership registers, delegate lists, desk allocations |
If you're unsure, start with party totals. It's simpler, faster, and covers most reports. Move to one row per seat when you specifically want each dot to be identifiable.
Shape A — party totals
One row per party, and a number.
| Party | Seats |
|---|---|
| Progressive Alliance | 41 |
| Civic Union | 33 |
| Green List | 18 |
| Independents | 8 |
Bind: Party → Party, Seats → Seat Count.
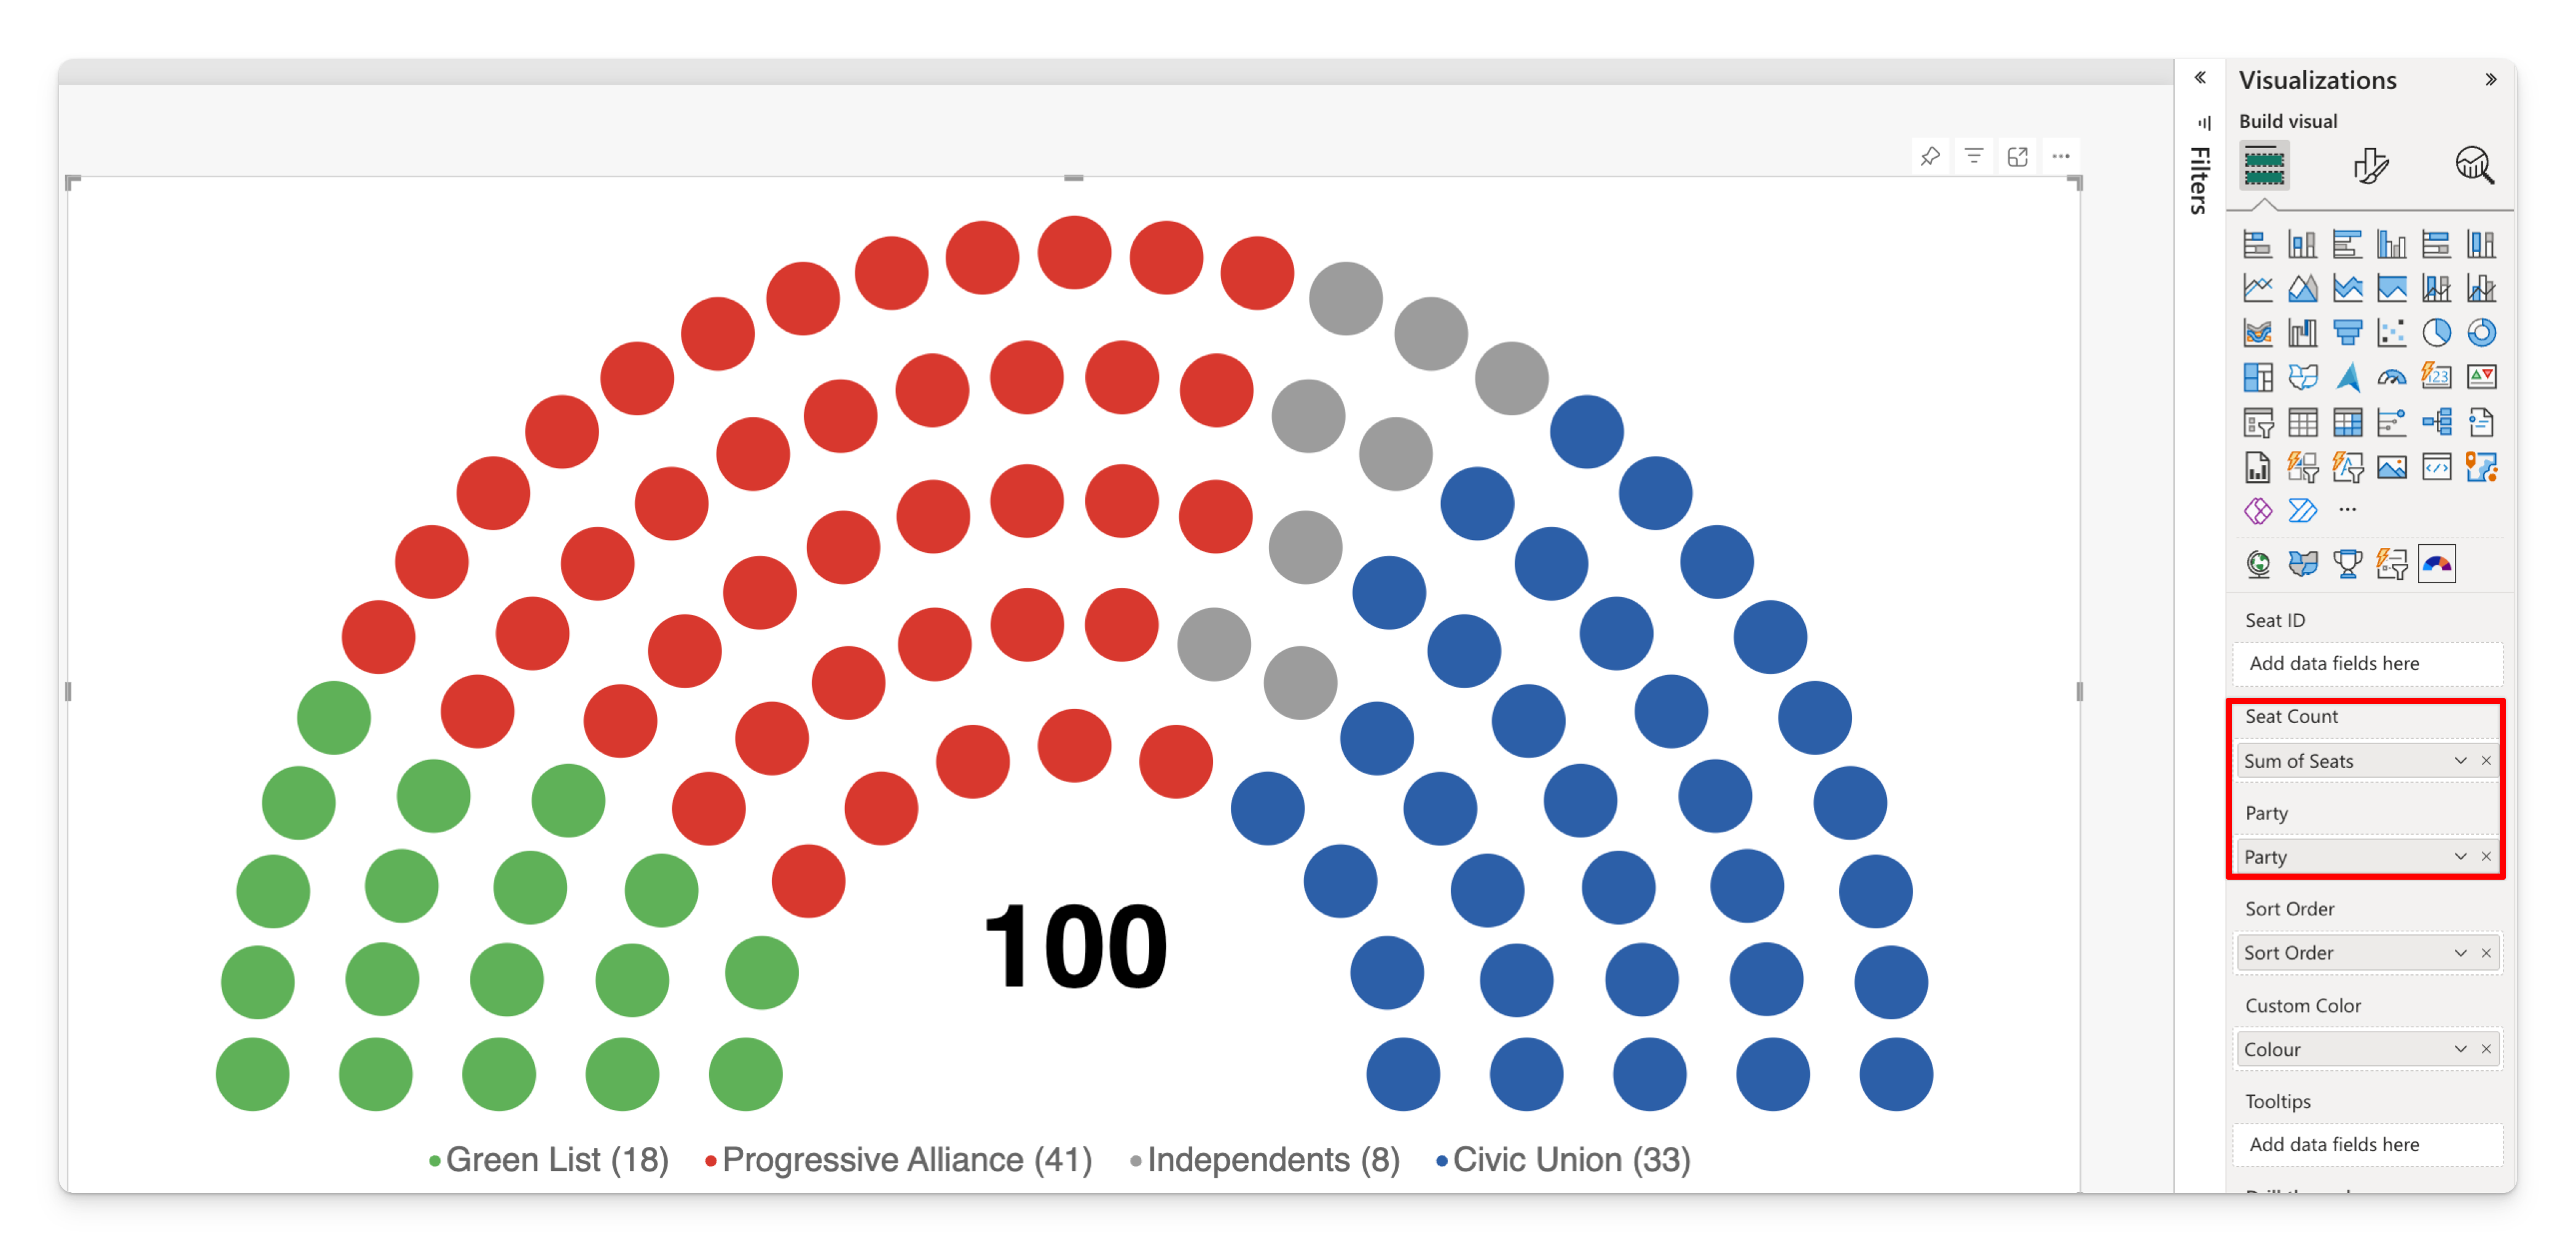
Rules that apply:
- The measure value is rounded to the nearest whole seat, and negatives are treated as zero.
- Your table can be finer-grained than one row per party — one row per constituency, per region, per candidate. Power BI sums it to one number per party before the visual sees it. That's the normal case, not an edge case.
- A party whose measure comes out blank or zero is simply not drawn, and gets no legend entry.
- Every seat in a party is identical, so they all share the same tooltip.
Add a column to the Tooltips well and each party splits into sub-groups — the seats stay contiguous within the party, but each sub-group's seats carry its own tooltip values. Binding Region this way turns a 41-seat bloc into its regional make-up on hover, without leaving party-totals mode. The party's total is unchanged.
Adding a sort order and colours
The full party-totals table in practice:
| Party | Seats | Sort Order | Colour |
|---|---|---|---|
| Green List | 18 | 1 | #5FB158 |
| Progressive Alliance | 41 | 2 | #D8382E |
| Independents | 8 | 3 | #9C9C9C |
| Civic Union | 33 | 4 | #2B5FA8 |
Bind: Party → Party, Seats → Seat Count, Sort Order → Sort Order, Colour → Custom Color.
That's a complete, self-contained parliament chart definition living in one small table — which makes it easy to reuse across reports.
Shape B — one row per seat
One row per seat, with whatever you want to know about that seat.
| Seat ID | Member | Party | Constituency | First elected |
|---|---|---|---|---|
| S-001 | A. Whitcombe | Progressive Alliance | Northgate | 2019 |
| S-002 | R. Delgado | Progressive Alliance | Ashvale East | 2024 |
| S-003 | M. Osei | Civic Union | Kingsmere | 2015 |
| S-004 | K. Lindqvist | Green List | Fenbrook | 2024 |
Bind: Party → Party, Seat ID → Seat ID, and Member, Constituency, First elected → Tooltips.
Keep First elected as text to show the full year in tooltips.
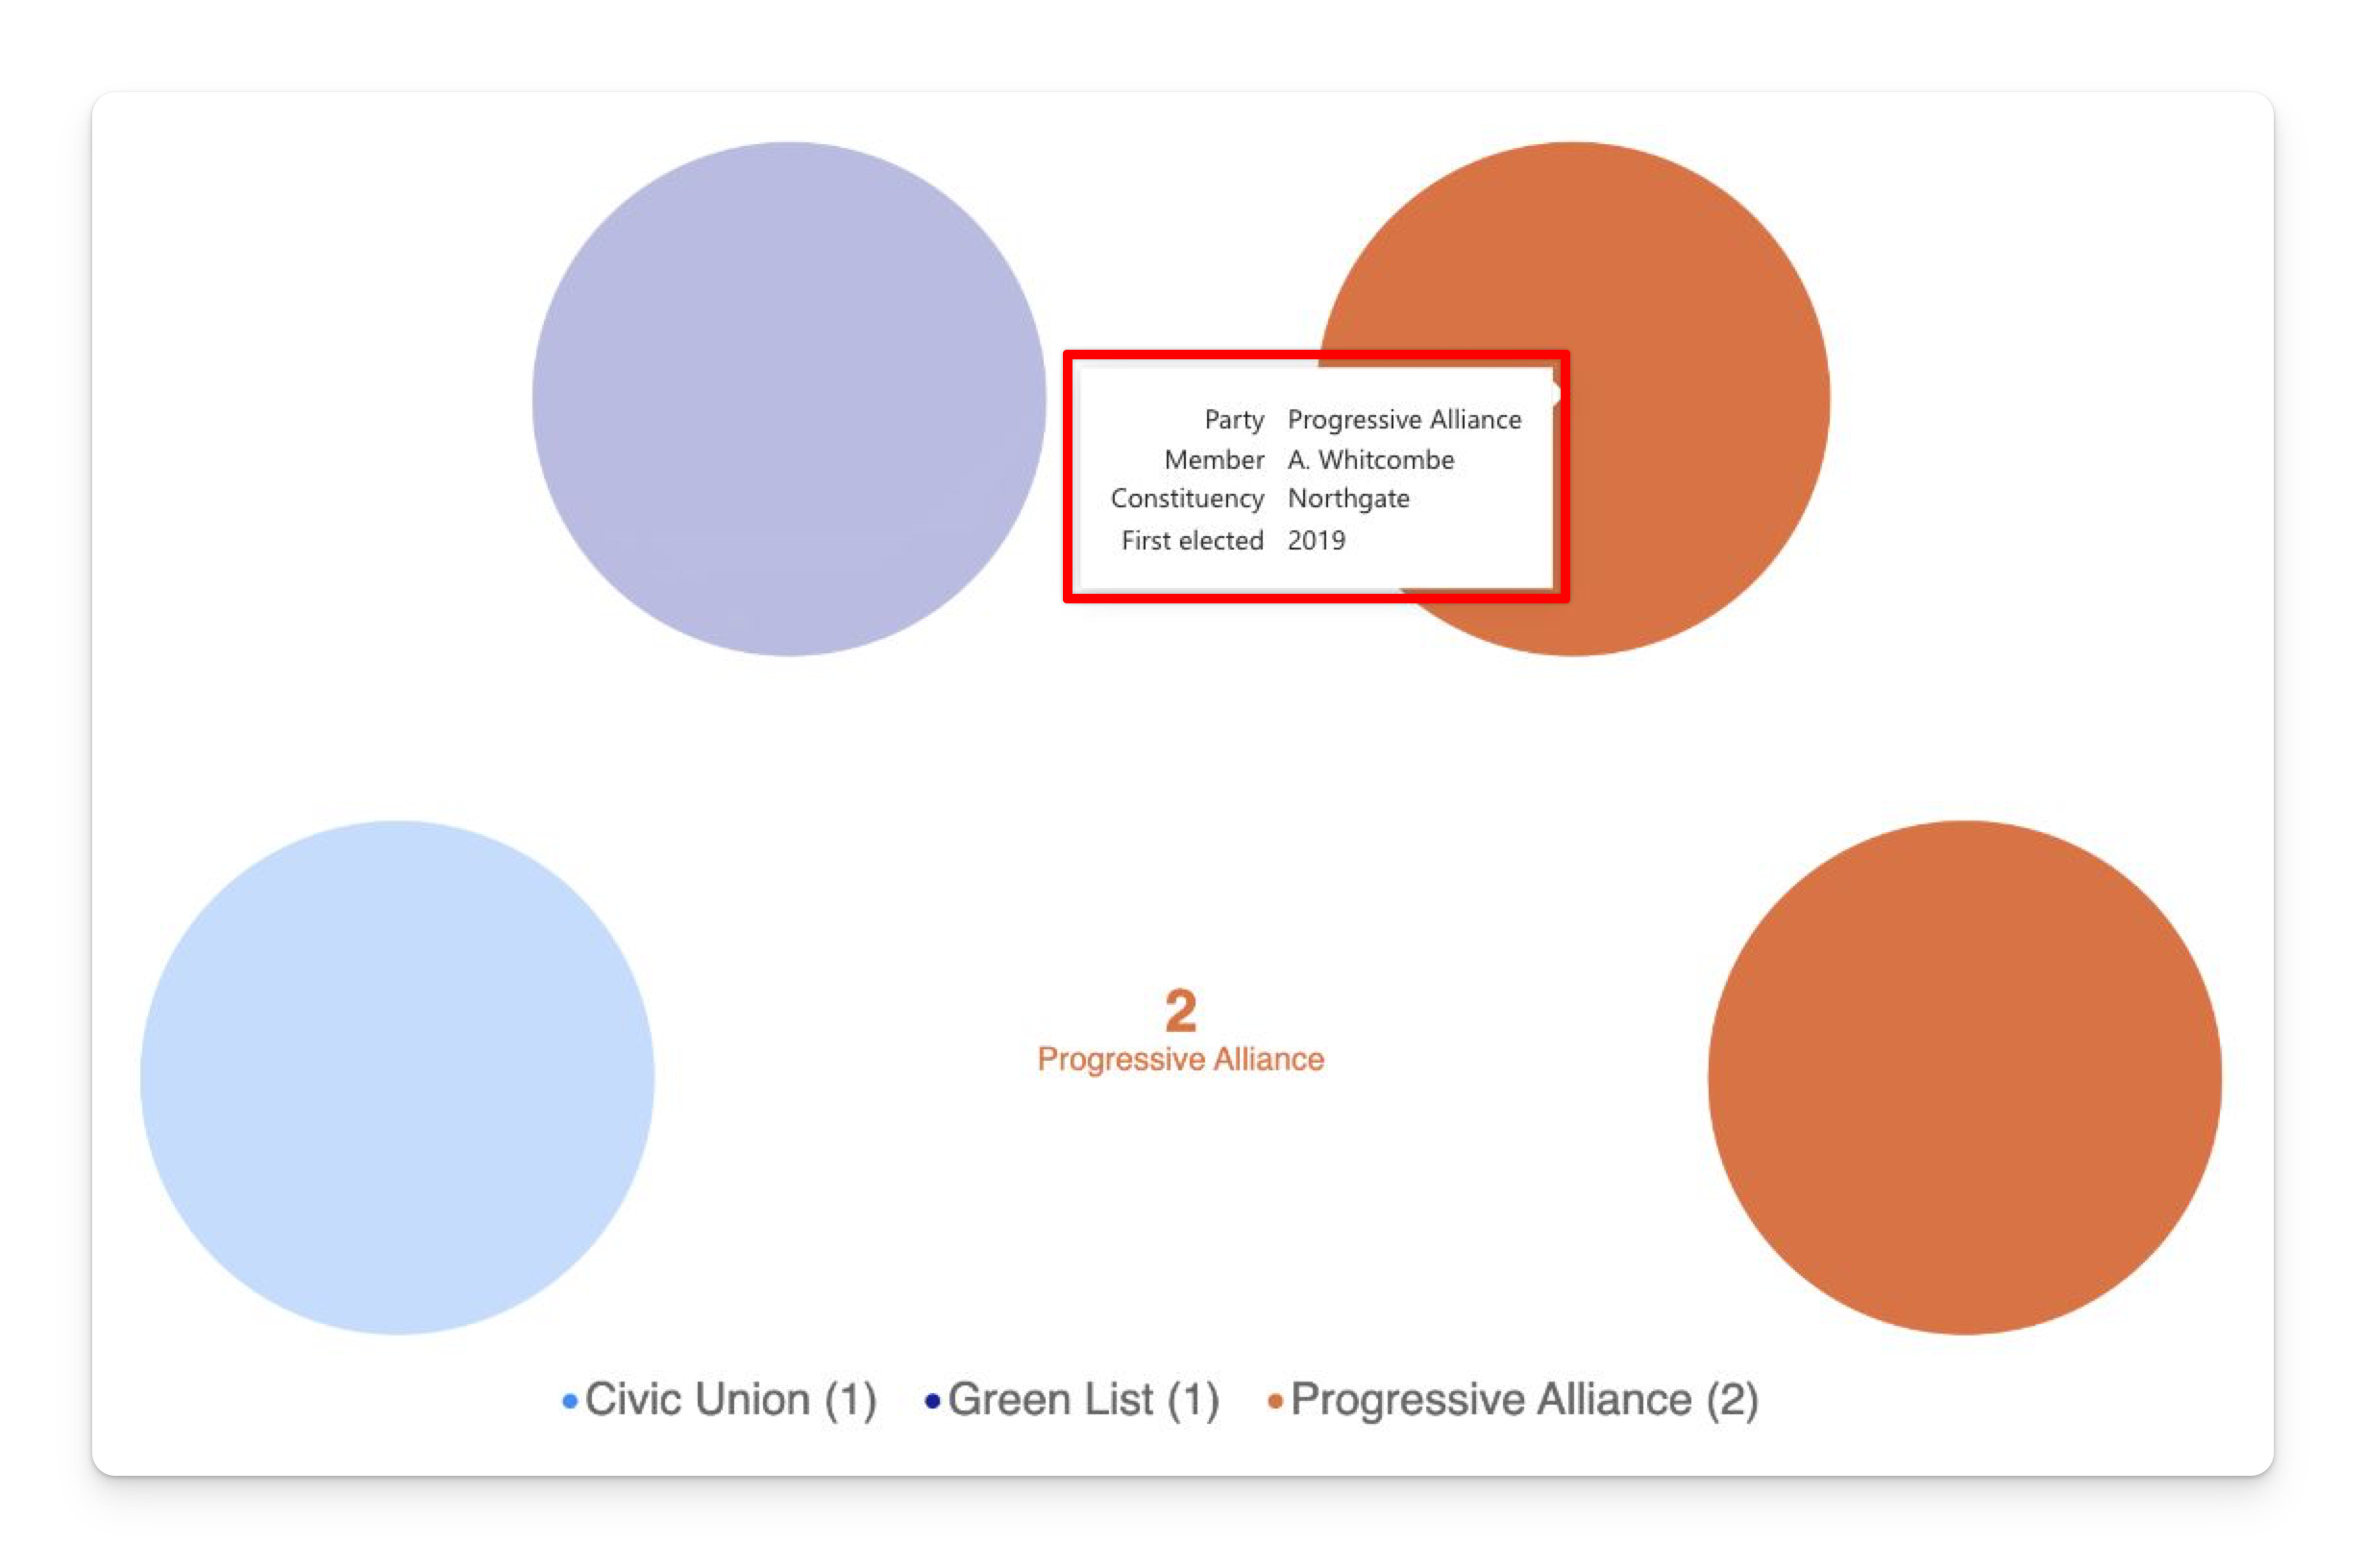
Rules that apply:
- One seat is drawn per distinct Seat ID, and Seat IDs must be unique across the whole dataset — see Seat ID.
- Seat Count is ignored for sizing in this mode. Bind it anyway if you want other visuals to be able to dim the arch — see below.
- Each seat carries its own Tooltips values. This is the entire reason to use this shape.
In per-seat mode, cross-highlighting from another visual only dims the excluded seats if a numeric measure is in the Seat Count well. Add something like:
Seats = COUNTROWS ( 'Members' )
The chart still sizes itself from the rows; the measure only tells the visual which seats another visual's selection kept. See Being filtered by other visuals.
Converting between the shapes
One row per seat → party totals
Do it in Power Query: select the Party column → Transform → Group By → New column name Seats, Operation Count Rows.
Or leave the detail table alone and let Power BI aggregate it: bind Party to Party and drop Seat ID into Seat Count with the aggregation set to Count. No modelling required.
Set the aggregation to Count, not the default First or Sum. Dropping a text column set to First puts text into a numeric well, and the visual will tell you so on the canvas.
Party totals → one row per seat
Occasionally you have totals but want per-seat rows — to attach a member list, for instance. In Power Query:
-
Select your party-totals table.
-
Add Column → Custom Column, name it
Seat, formula:= { 1 .. [Seats] } -
Expand the new column (the ⇄ icon) → Expand to New Rows.
-
Add Column → Index Column to get a unique key, or build one with
[Party] & "-" & Text.From([Seat]).
You now have one row per seat, ready for the Seat ID well.
What if you bind both?
Binding Seat ID and Seat Count is a valid, useful combination — it's per-seat mode with cross-highlight support. Seat ID always wins for sizing:
| Bound | Result |
|---|---|
| Party + Seat Count | Party totals mode. |
| Party + Seat ID | Per-seat mode. No cross-highlight dimming. |
| Party + Seat ID + Seat Count | Per-seat mode, with cross-highlight dimming. The recommended per-seat setup. |
| Seat Count or Seat ID with no Party | Landing page — Party is always required. |
Shapes that won't work
- A cross-tab layout. Parties spread across columns (
Labour,Conservative,Green… as headers) can't be read. Unpivot them in Power Query first — select the party columns → Transform → Unpivot Columns — to get aParty/Seatspair. - Pre-computed seat coordinates. Row numbers, angles, x/y positions: the visual calculates all of these itself and has nowhere to put yours. Drop those columns.
- Multiple measures. Only one Seat Count measure is read. To compare two scenarios (current vs projected), use two Parliament Charts side by side, or a field parameter to switch the measure.
- A party column with more than one value per seat. A member belonging to two groups needs a decision in the model about which one they sit with; the chart can only place them once.
The seat limit
In party totals mode the visual draws at most 10,000 seats in total. Above that it shows a message instead of a chart:
This chart can display at most 10,000 seats. Reduce the seat count or filter the data.
It refuses rather than truncating on purpose — a chart missing whole parties looks complete and isn't. If you hit it, you're almost certainly not drawing a parliament any more: scale your measure down ([Headcount] / 10, one dot per ten people) and say so in the title, or filter.
In per-seat mode, Power BI's own row limits apply before the visual sees anything. The quickest sanity check is the number in the middle of the arch: if it doesn't match the chamber size you expect, your rows are being reduced upstream — switch to party totals, which sends a handful of rows regardless of chamber size.
Next steps
- Sample data — ready-made tables for both shapes.
- Data fields — the per-field reference.
- Layout & arc — how those seats get arranged.