Timeline & navigation
This page covers how the timeline is scaled and how people move around the chart: zoom levels, the starting view, the Today line, search, and the top bar. All of these live in the Format pane (the paint-roller icon) unless noted.
Zoom
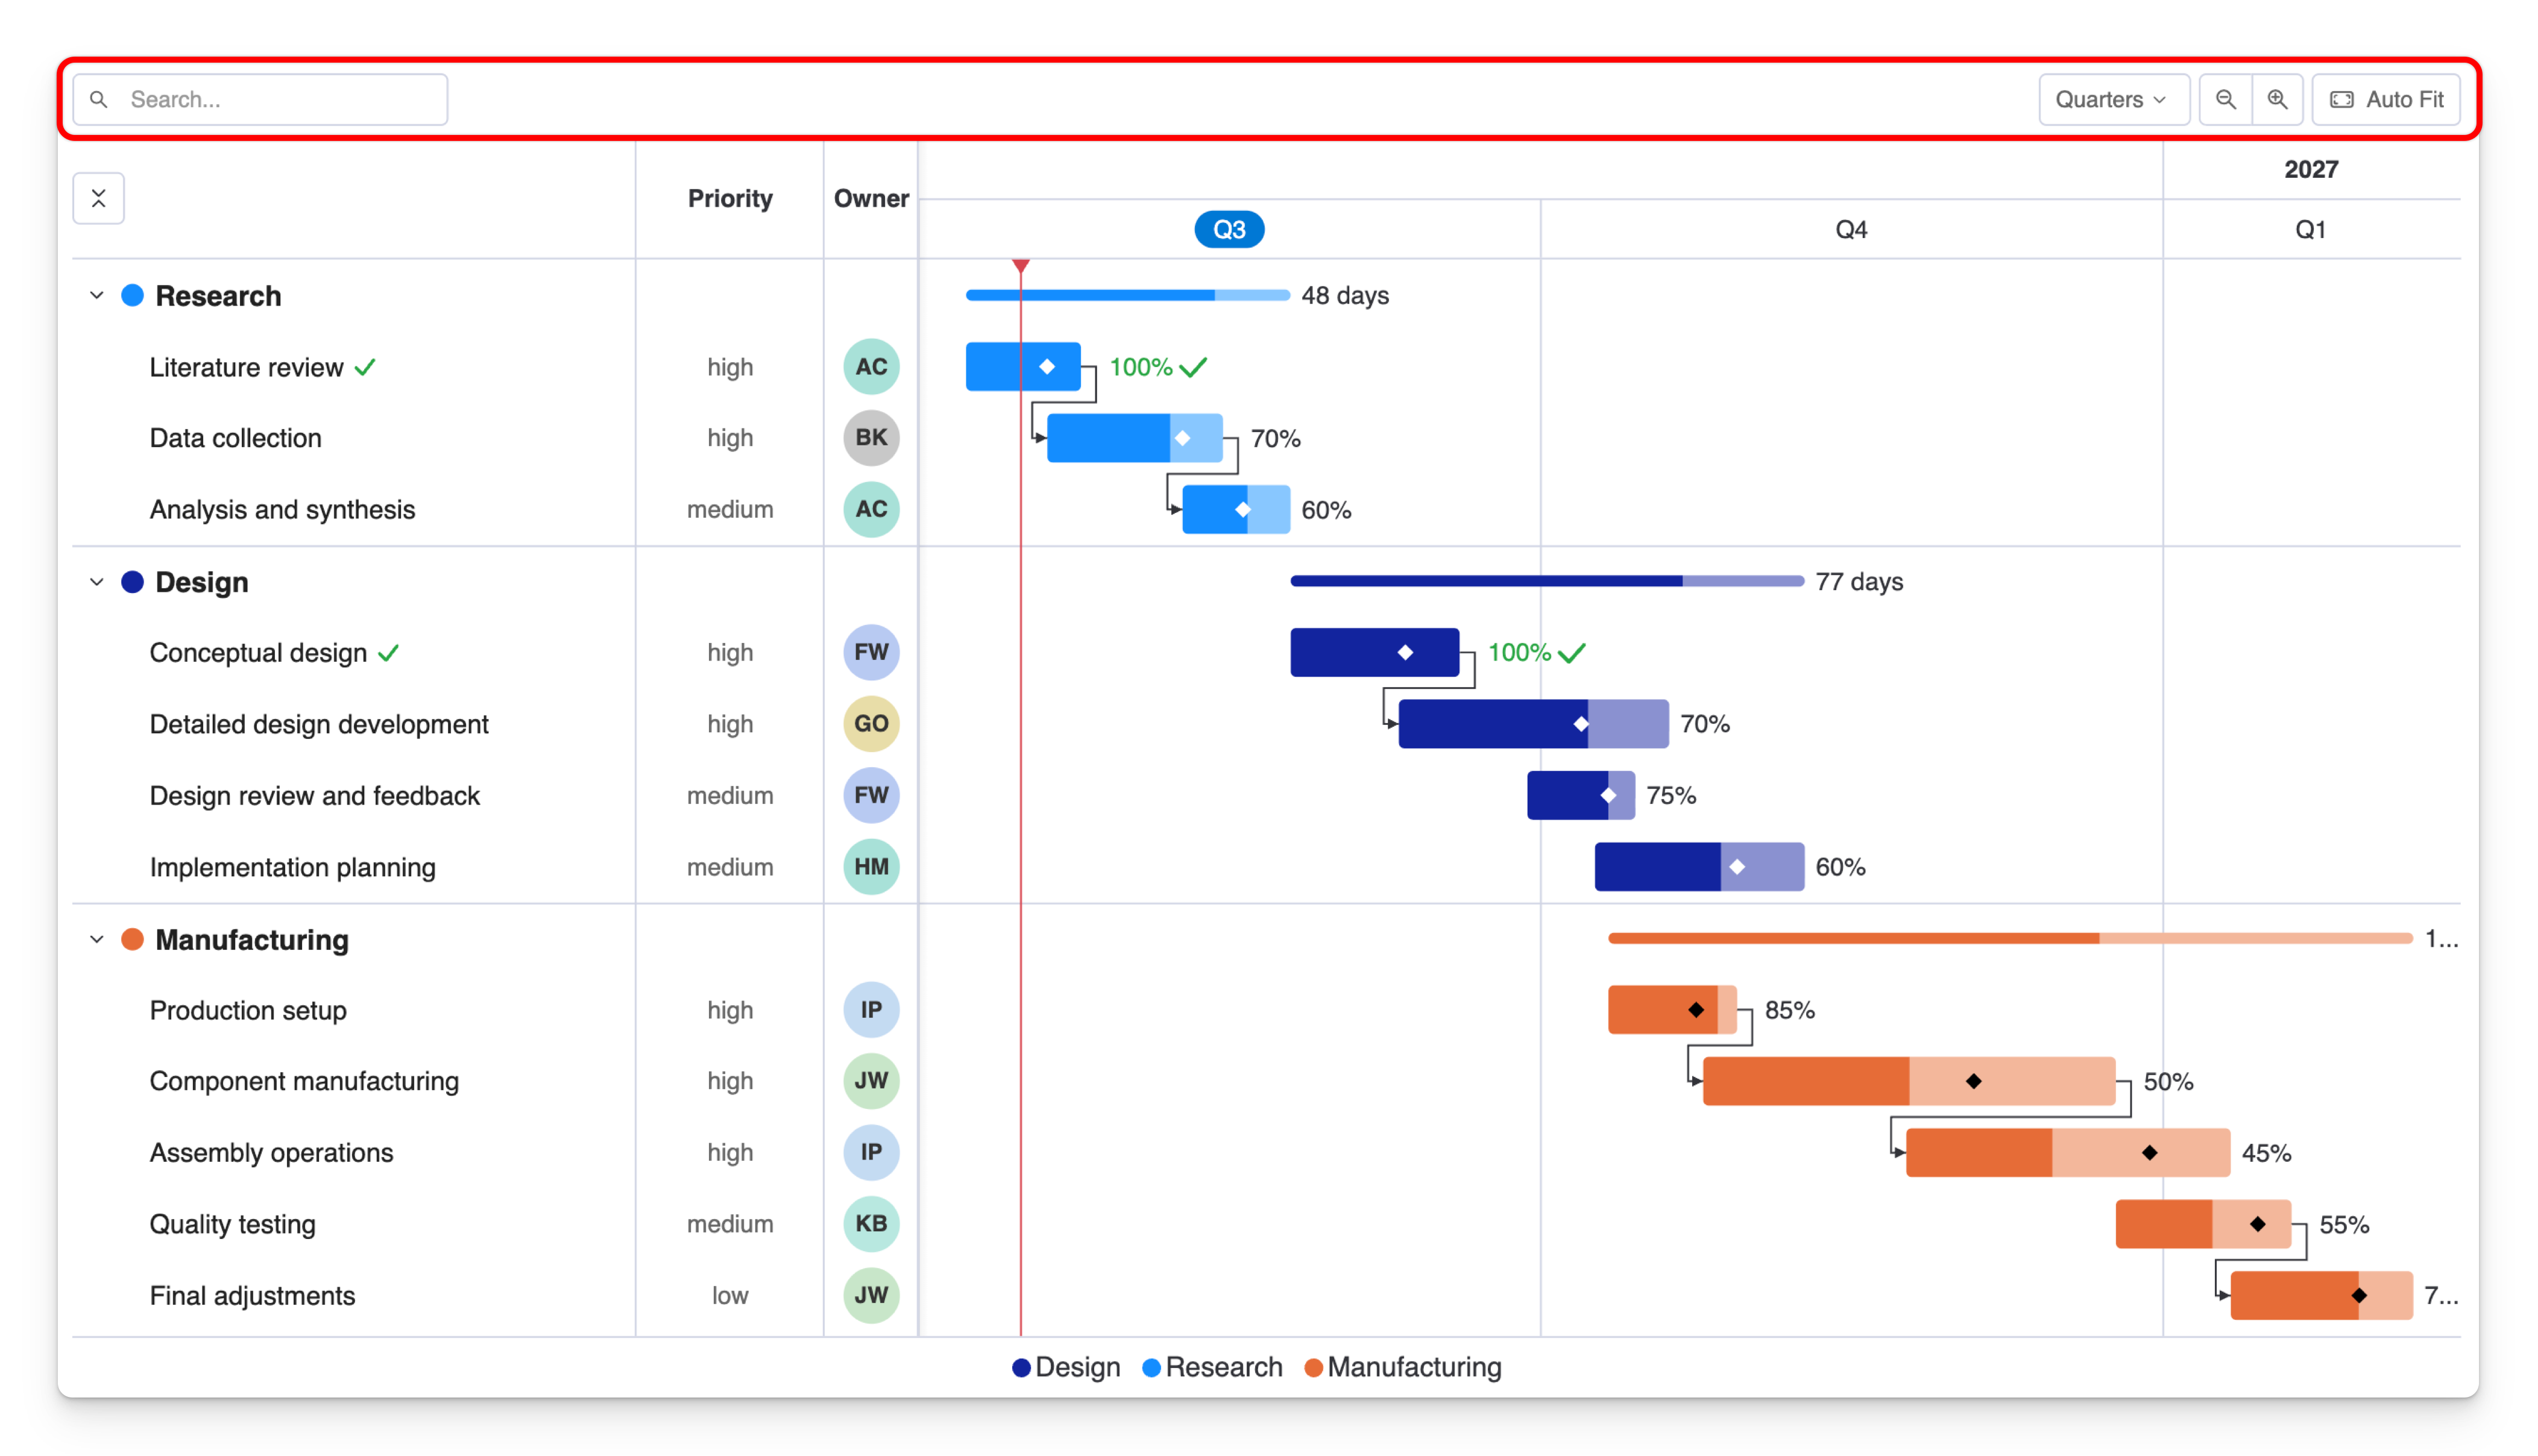
The timeline can be viewed at six scales. Report viewers can change the zoom live using the controls in the top bar; you set the level the report opens at in the Format pane.
Available scales: Auto Fit · Day · Week · Month · Quarter · Year.
- Auto Fit sizes the timeline so the whole project fits the visual's width.
- The other scales set a fixed density (e.g. Day shows every day; Quarter compresses to quarters).
Set the default zoom
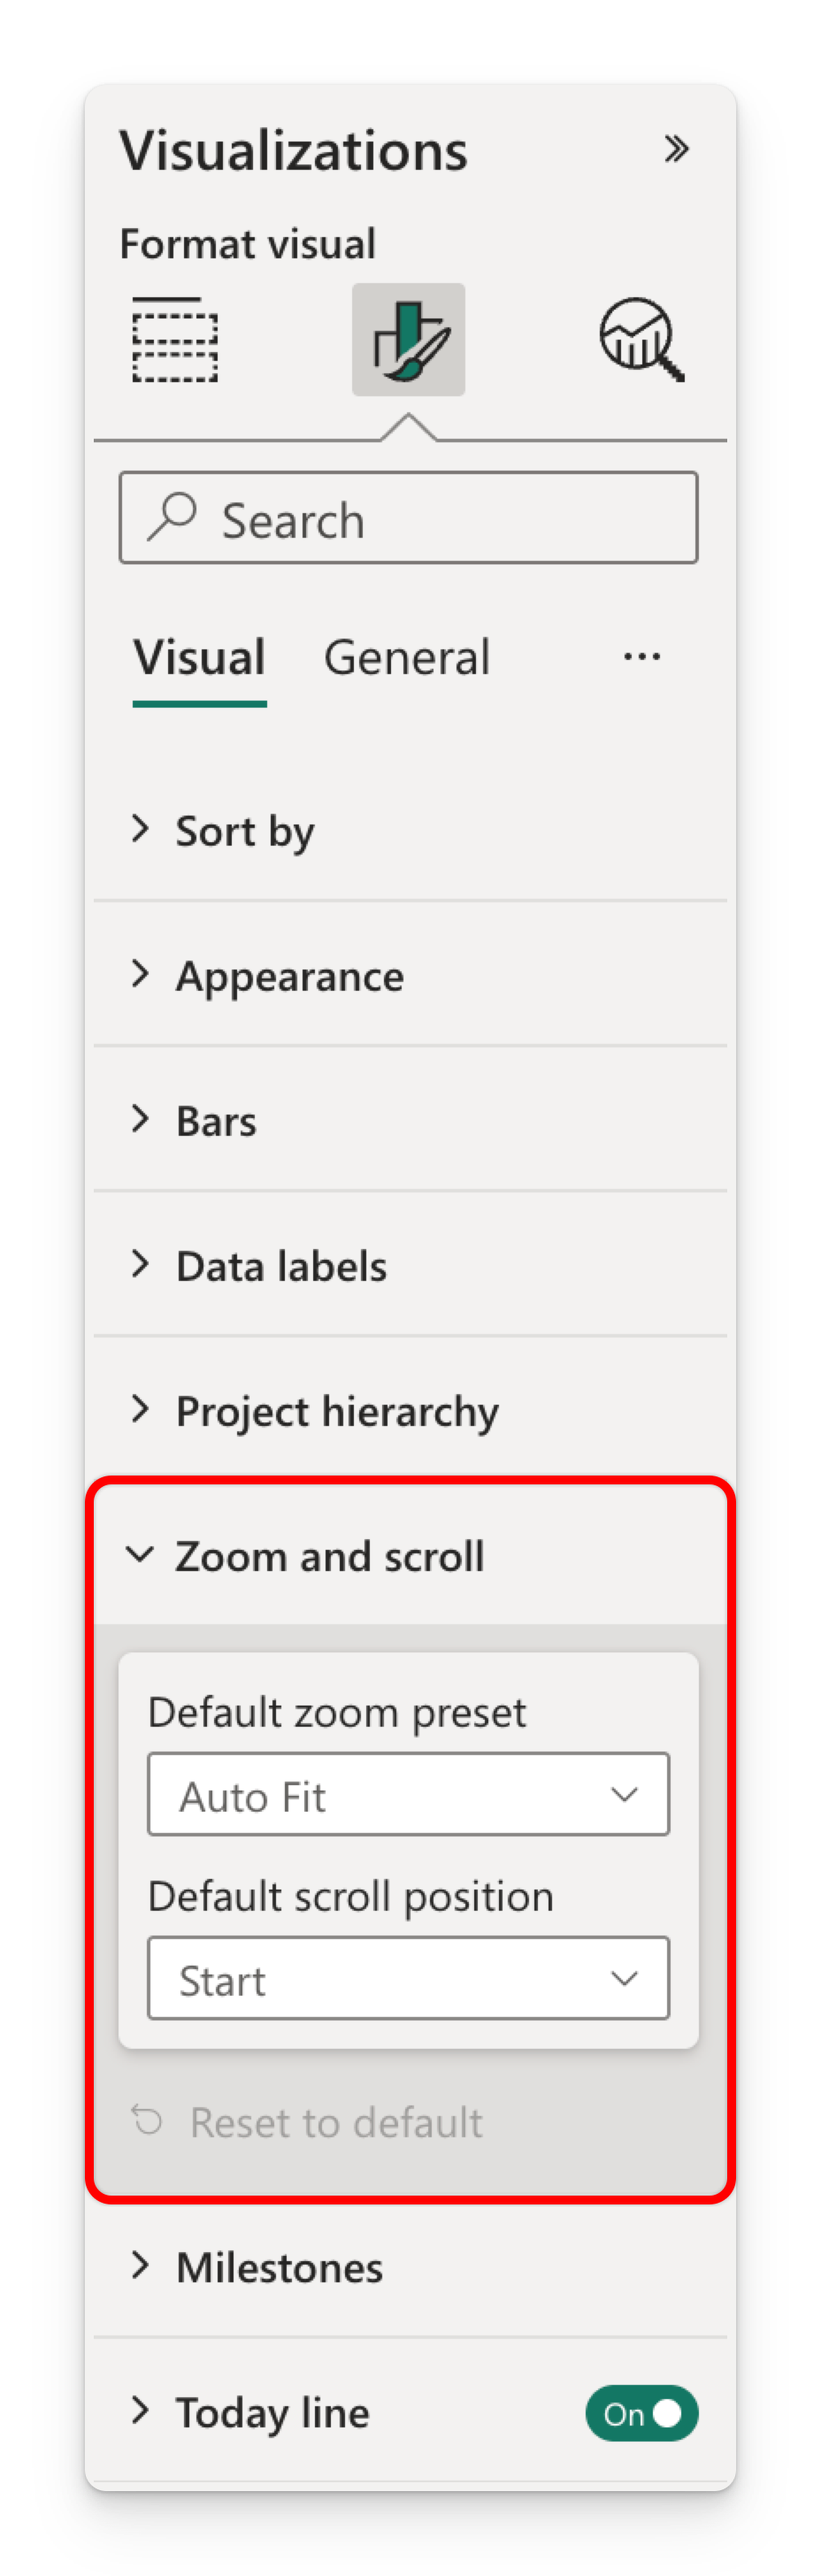
Format → Zoom and scroll → Default zoom preset
Choose the scale applied when the report loads. Default: Auto Fit.
Default scroll position
Format → Zoom and scroll → Default scroll position
When the timeline is wider than the visual, this sets where it's scrolled to on load:
- Start — the beginning of the schedule (default).
- Today — centered on the current date.
- End — the end of the schedule.
Pair Default scroll position → Today with a Week or Month zoom to open reports right at the current point in the project.
Today line
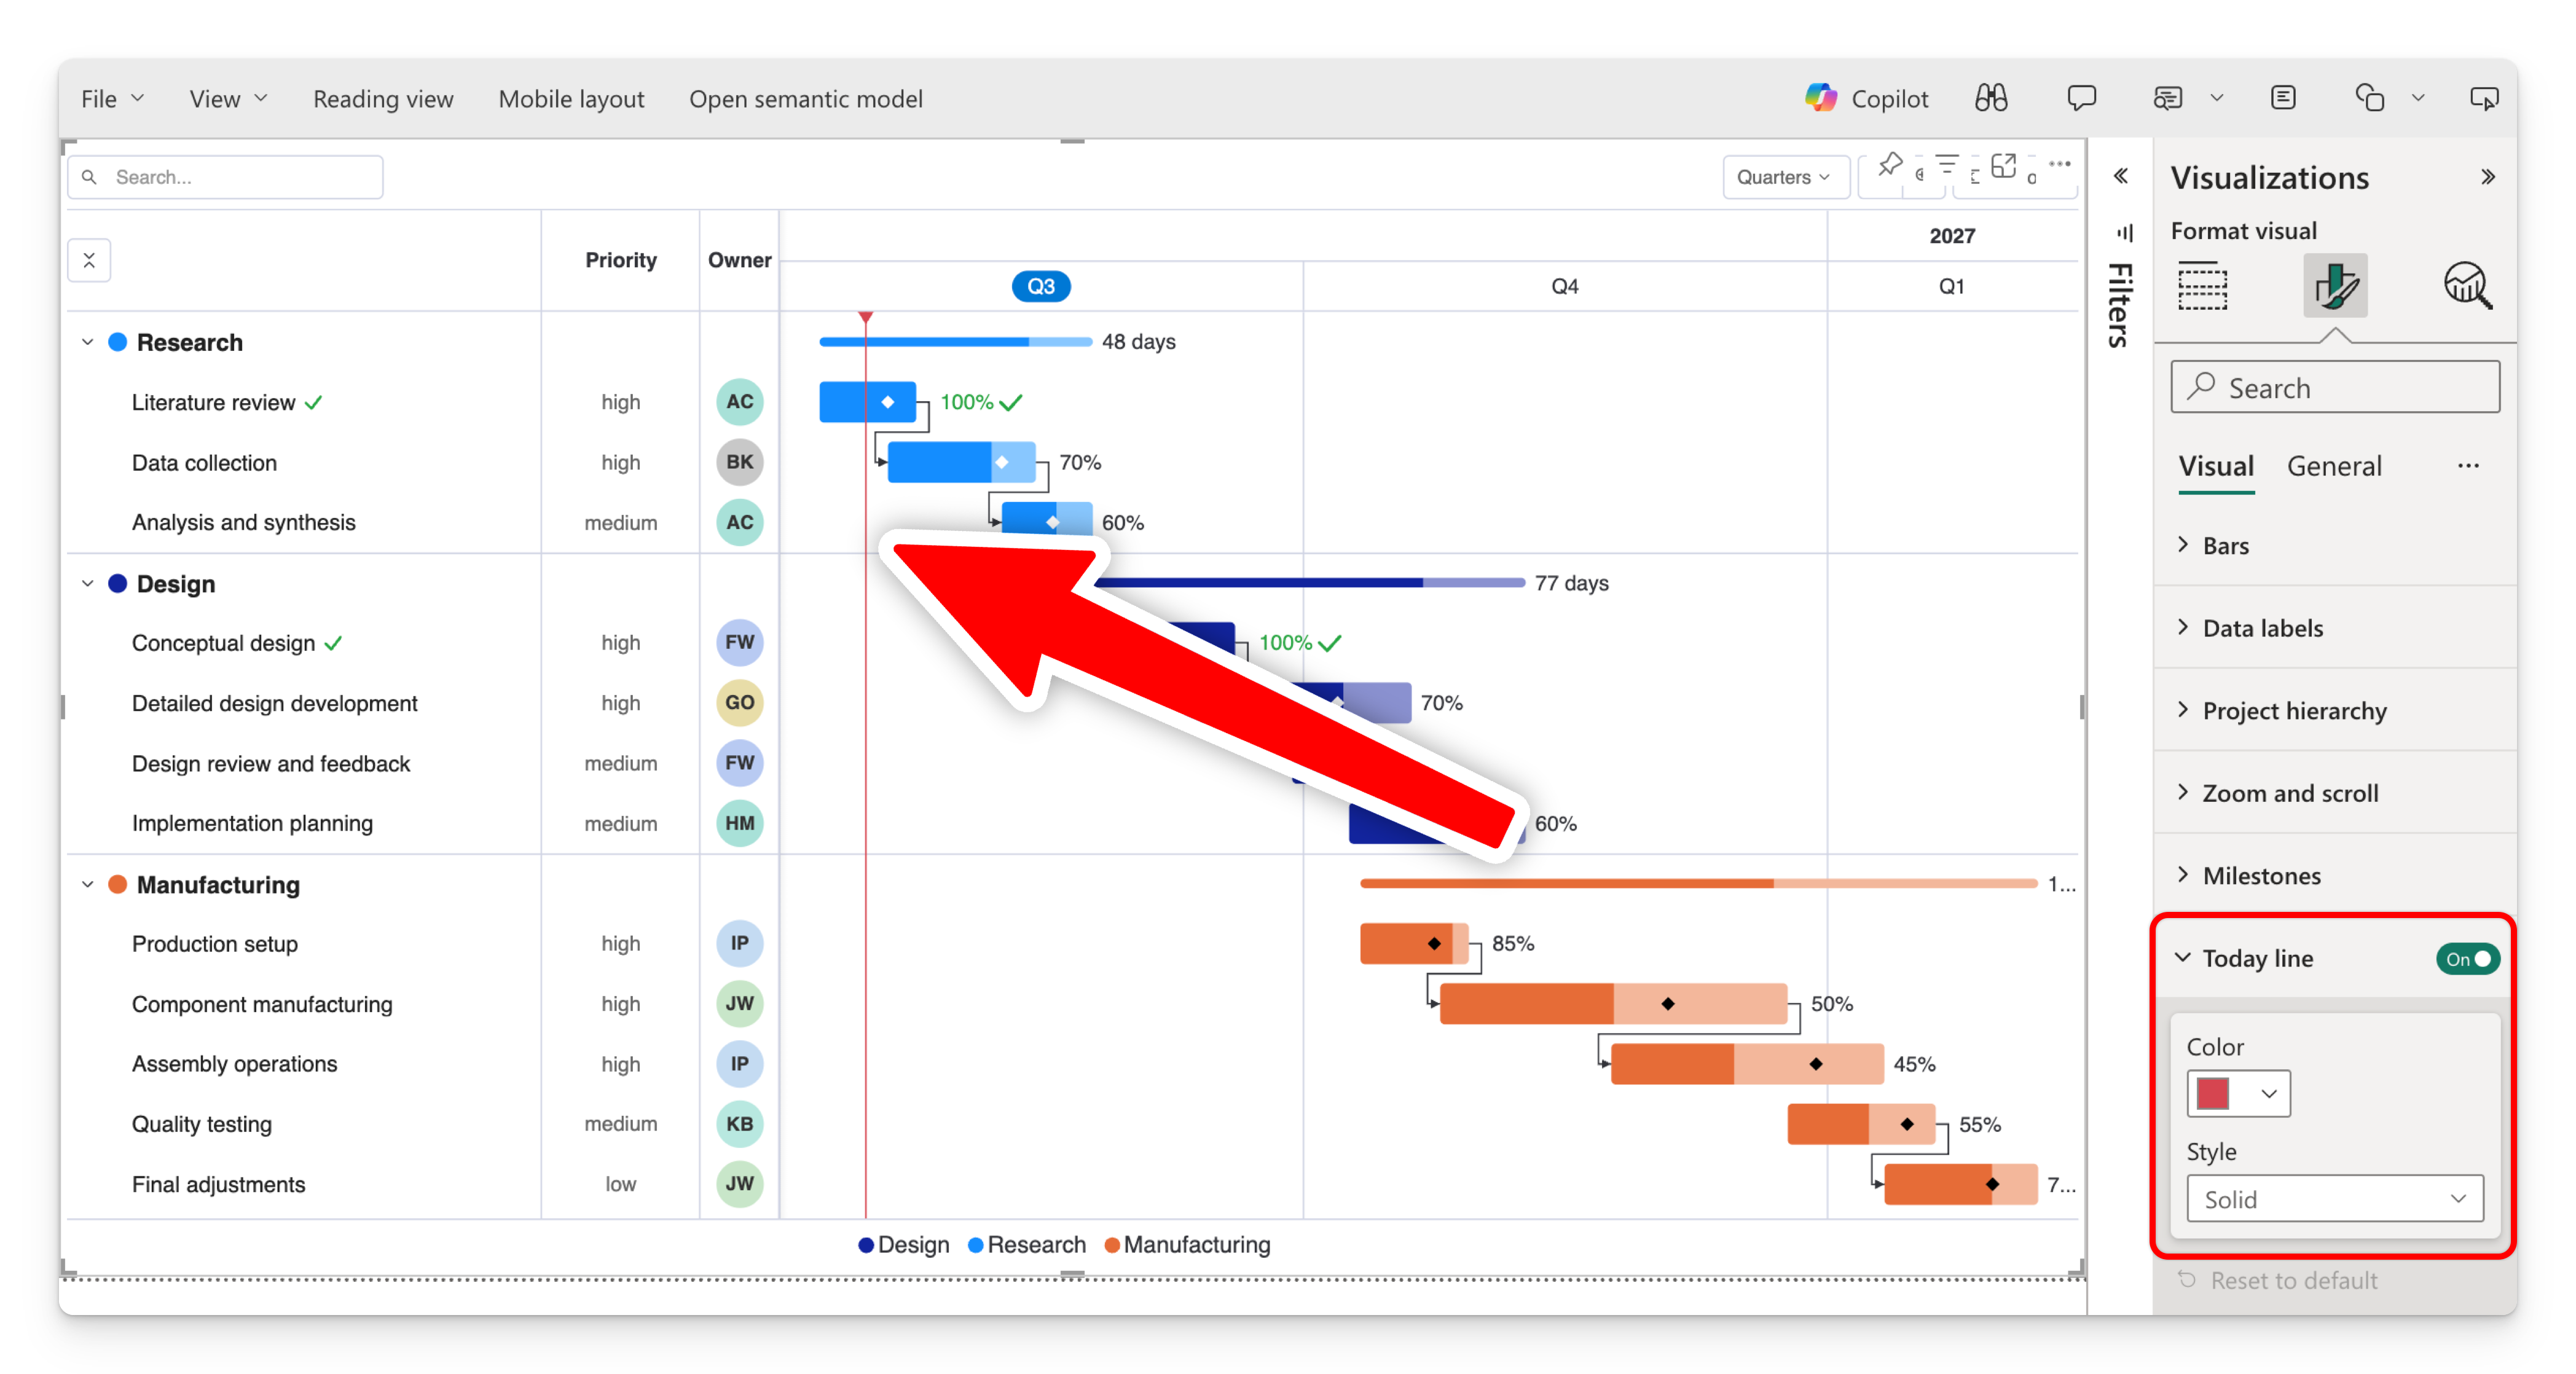
Format → Today line
A vertical line marking the current date, so viewers can instantly see what's overdue and what's upcoming.
| Setting | What it does | Default |
|---|---|---|
| Show | Turns the Today line on or off. | On |
| Color | The line's color. | #D64550 (red) |
| Style | Solid, Dashed, or Dotted. | Solid |
The top bar (search & zoom controls)
Format → Appearance → Top bar
The top bar holds the search box and the zoom controls, grouped together on the left. You can hide the whole bar or just the search box.
| Setting | What it does | Default |
|---|---|---|
| Show top bar | Shows or hides the entire top bar (search and zoom controls). | On |
| Show search bar | Shows or hides just the search box. | On |
Hiding the top bar also hides the on-chart zoom controls. Viewers can still see the chart at your Default zoom preset, but they won't be able to change the zoom interactively.
Searching
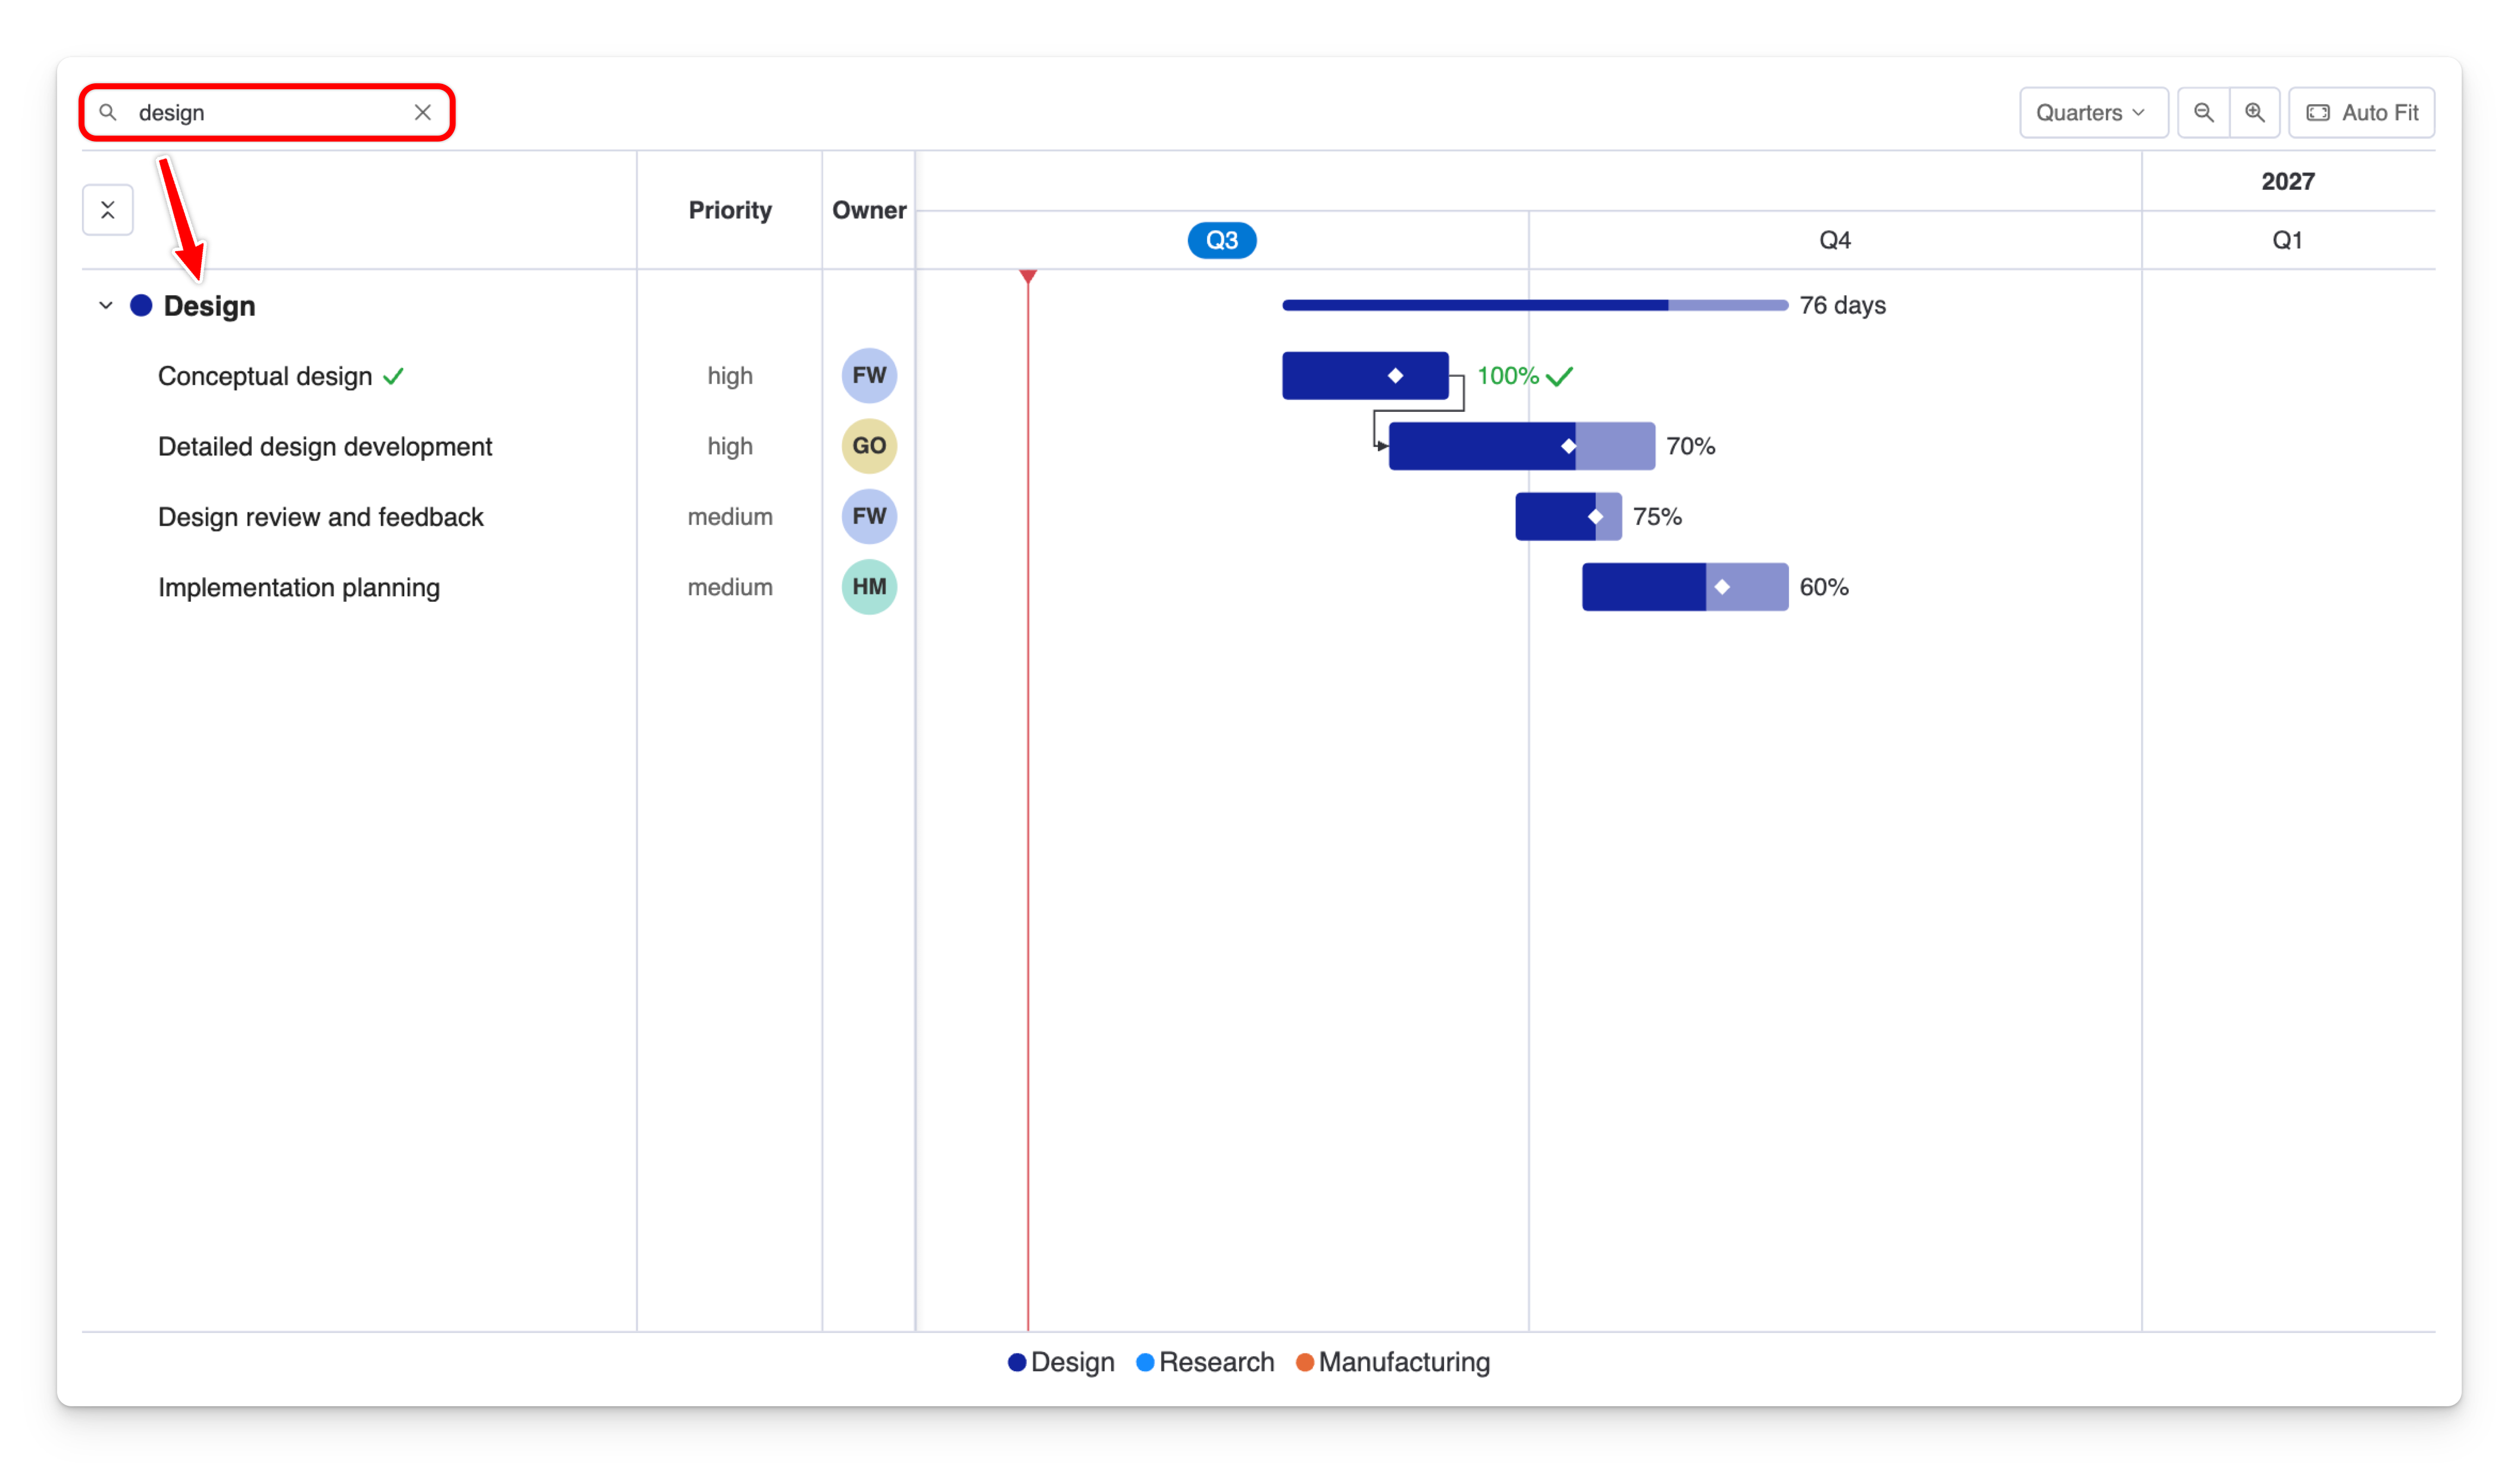
When the search box is visible, viewers can type to find and highlight tasks by name — handy for large projects. Search is a viewing aid; it doesn't filter the underlying data.
Keyboard navigation
The task list is a treegrid: press Tab to move focus into it, then navigate the rows with the keyboard. Focus is always visible, and the chart scrolls to follow it.
| Key | What it does |
|---|---|
| ↑ / ↓ | Move to the previous / next row |
| → | Expand a collapsed parent, or move to its first child |
| ← | Collapse an expanded parent, or move up to its parent |
| Page Up / Page Down | Move one screenful |
| Home / End | Jump to the first / last row |
| Enter or Space | Expand or collapse a parent; select a task |
| Ctrl/⌘ + Enter | Add a task to the current selection |
| → on a task with links | Open its URLs |
Task names, hierarchy level, owner and extra-column values are all exposed to screen readers, and hover, selection and focus states stay visible in high-contrast mode.
When a report author turns off the visual's interactions, the chart becomes static: selection, collapsing and the resize handle are all disabled.
Related
- Change bar sizes and grid lines → Progress, colors & appearance
- Full list of settings → Formatting reference