Tasks, milestones & dependencies
This page covers the structure and scheduling elements of the chart: the task hierarchy and how it's ordered, milestone markers, and dependency arrows between tasks.
The task hierarchy
The hierarchy comes from the Category field — each column is one level of nesting (see Fields → Category). This section covers how it's displayed and controlled.
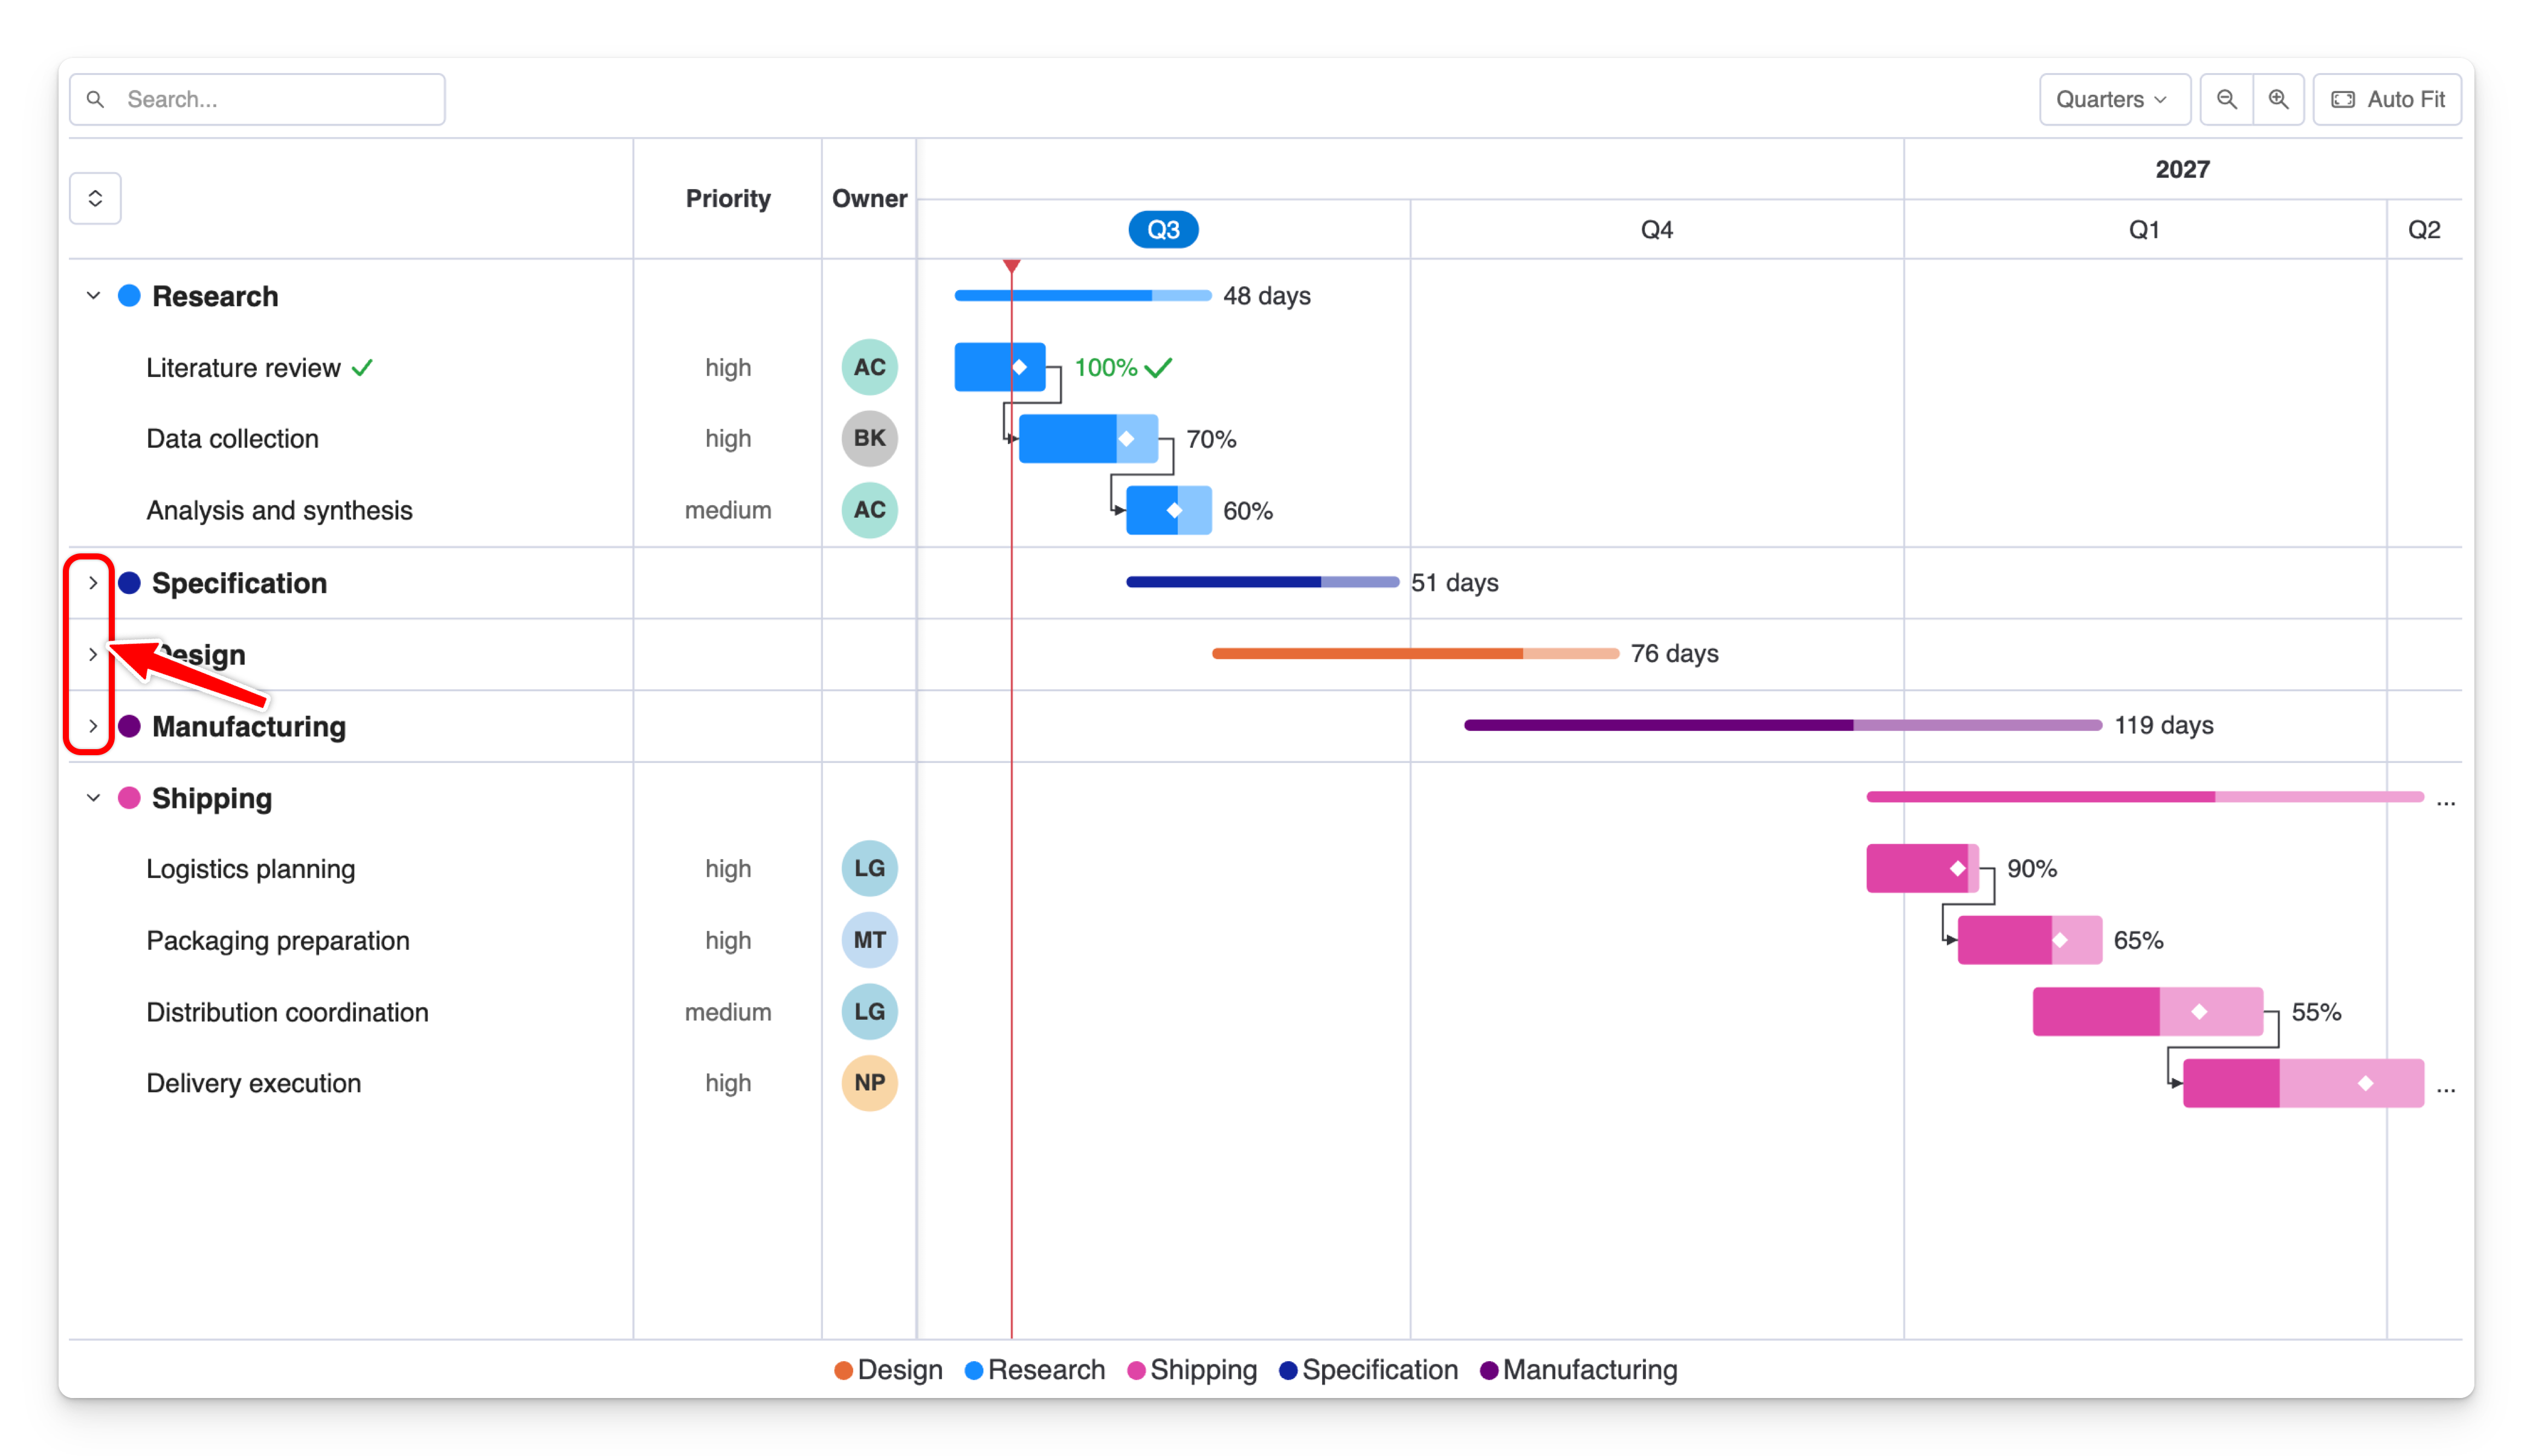
Expand & collapse
Every parent row has a toggle to expand or collapse its children. The state is remembered — if you collapse a project in editing and save, viewers see it collapsed. Collapse and expand state is also captured by Power BI bookmarks, so you can build guided views.
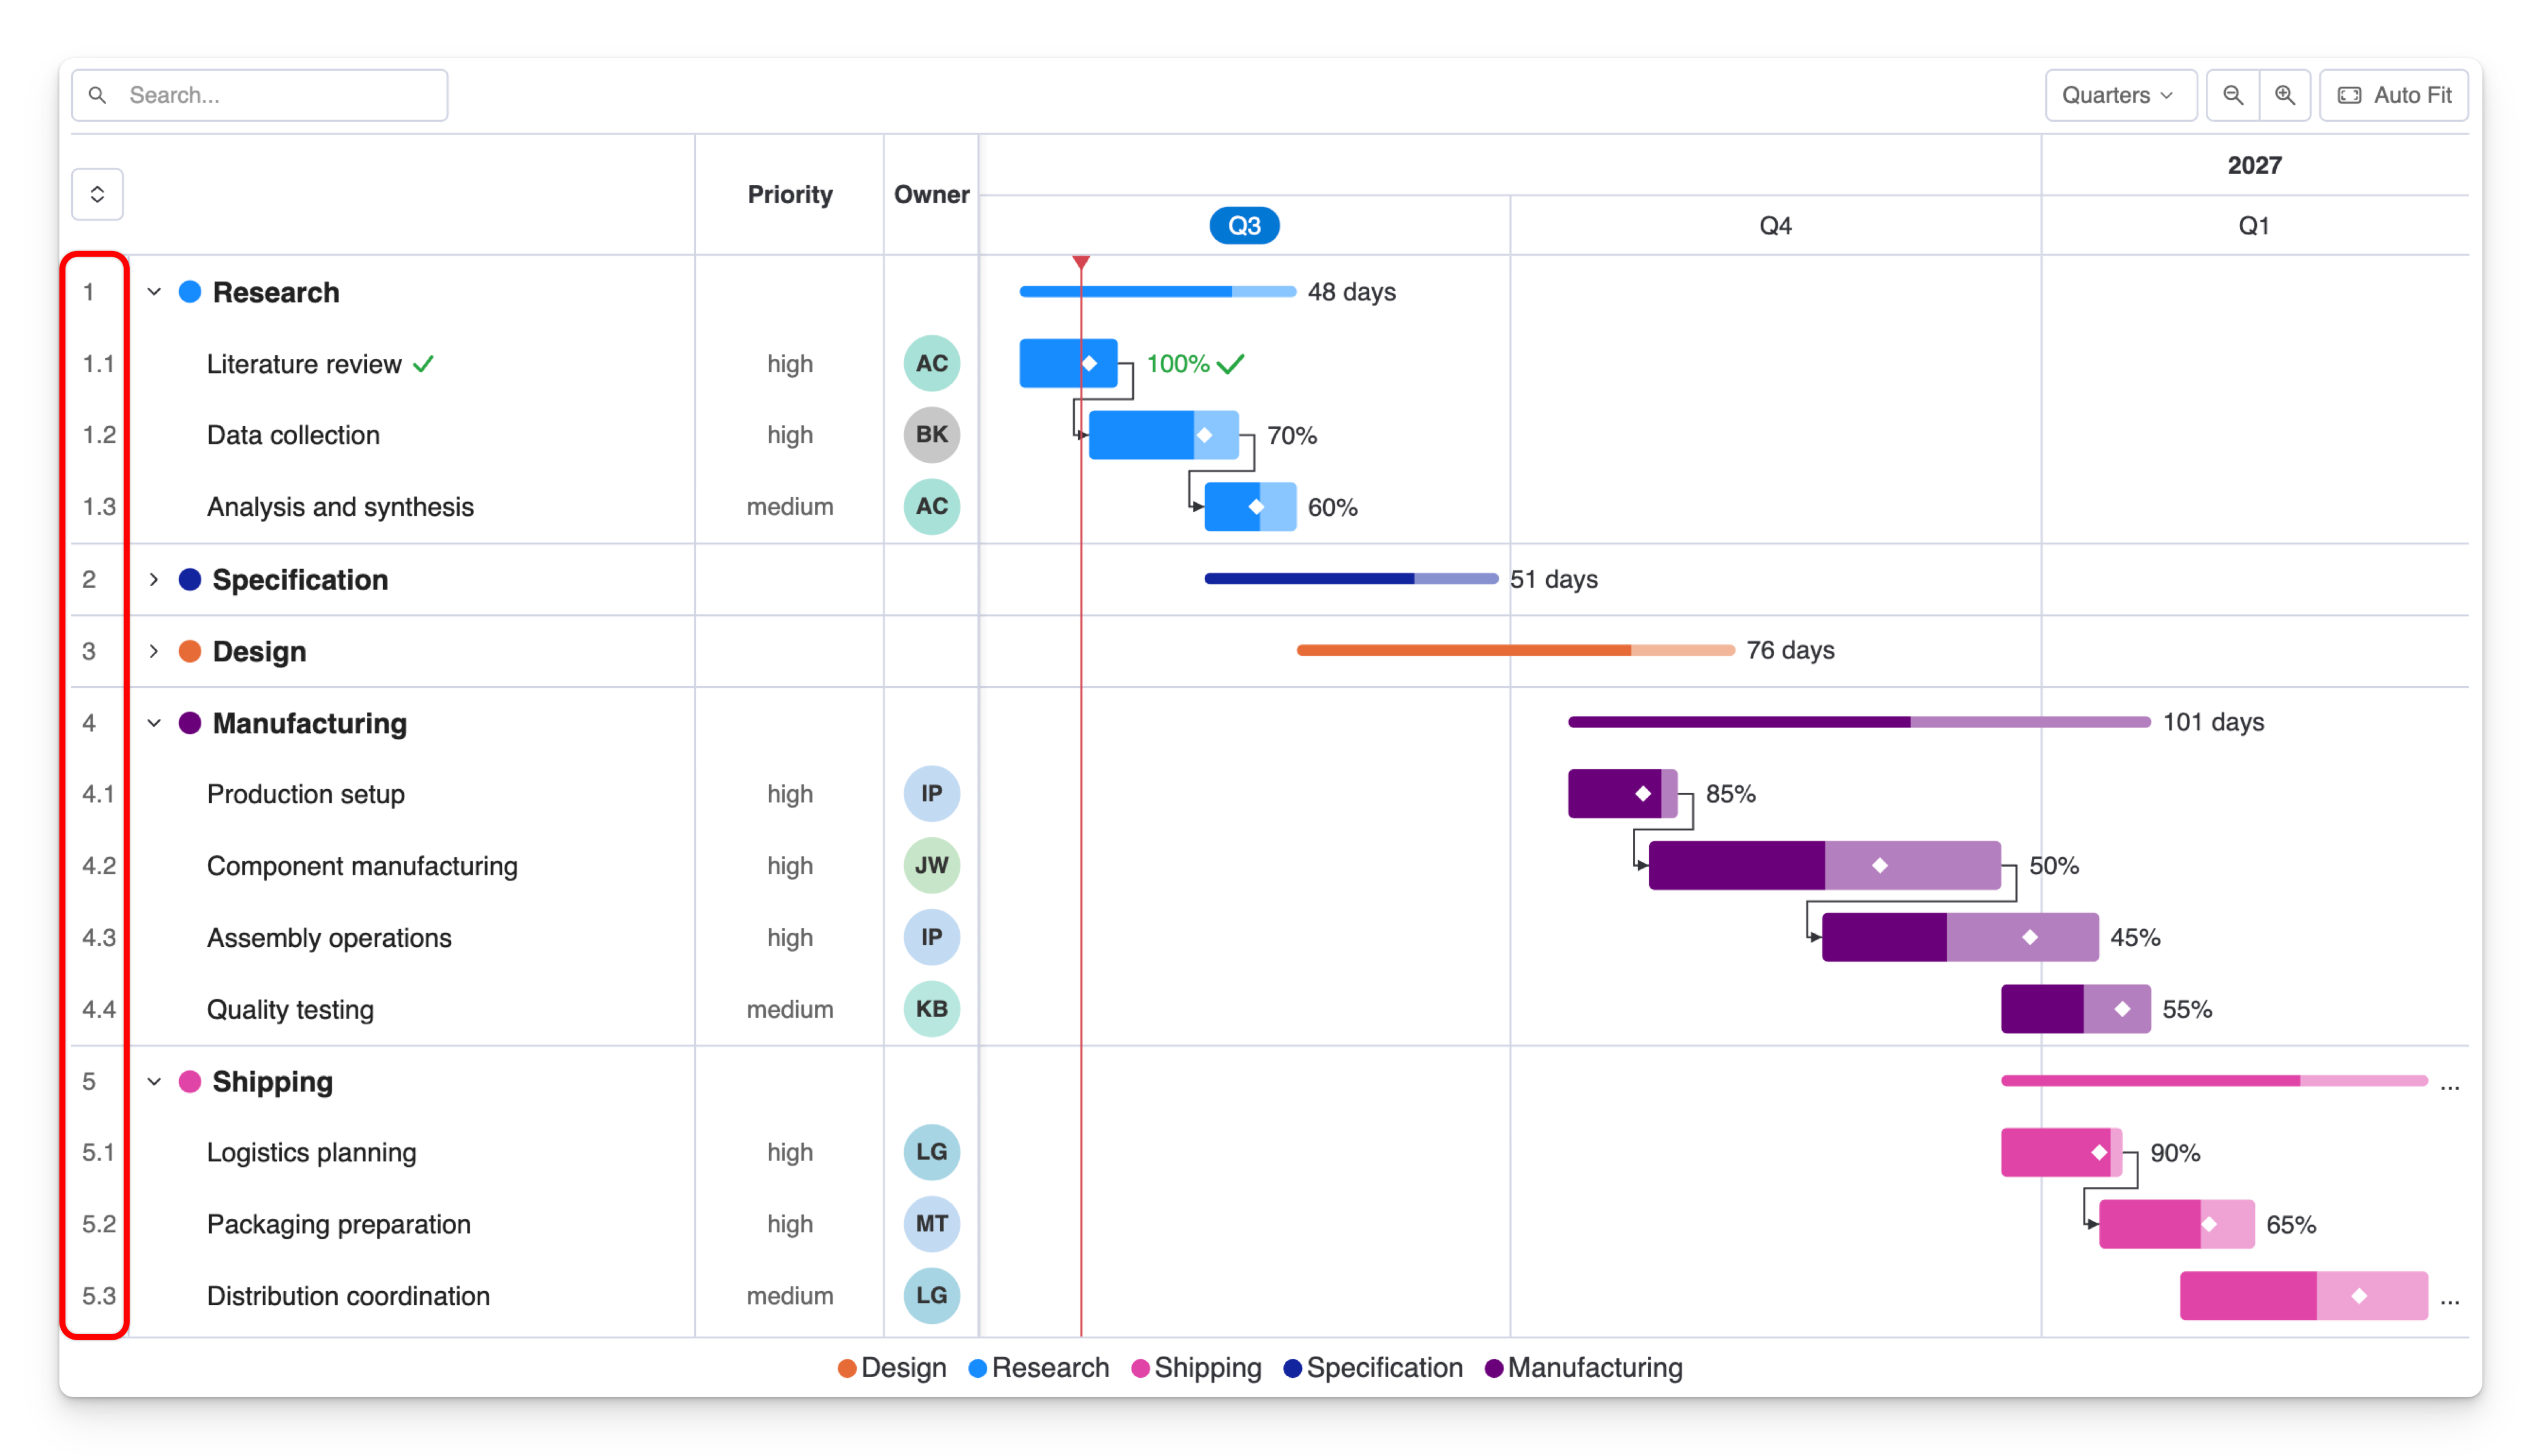
Row numbers (WBS)
Format → Project hierarchy → Row numbers
Turns on a Work Breakdown Structure number column to the left of the task list (e.g. 1, 1.1, 1.2, 2). Off by default.
Color swatches
Format → Project hierarchy → Show color swatches
Shows a small color chip next to each project/parent name in the task list, matching its bar color. On by default.
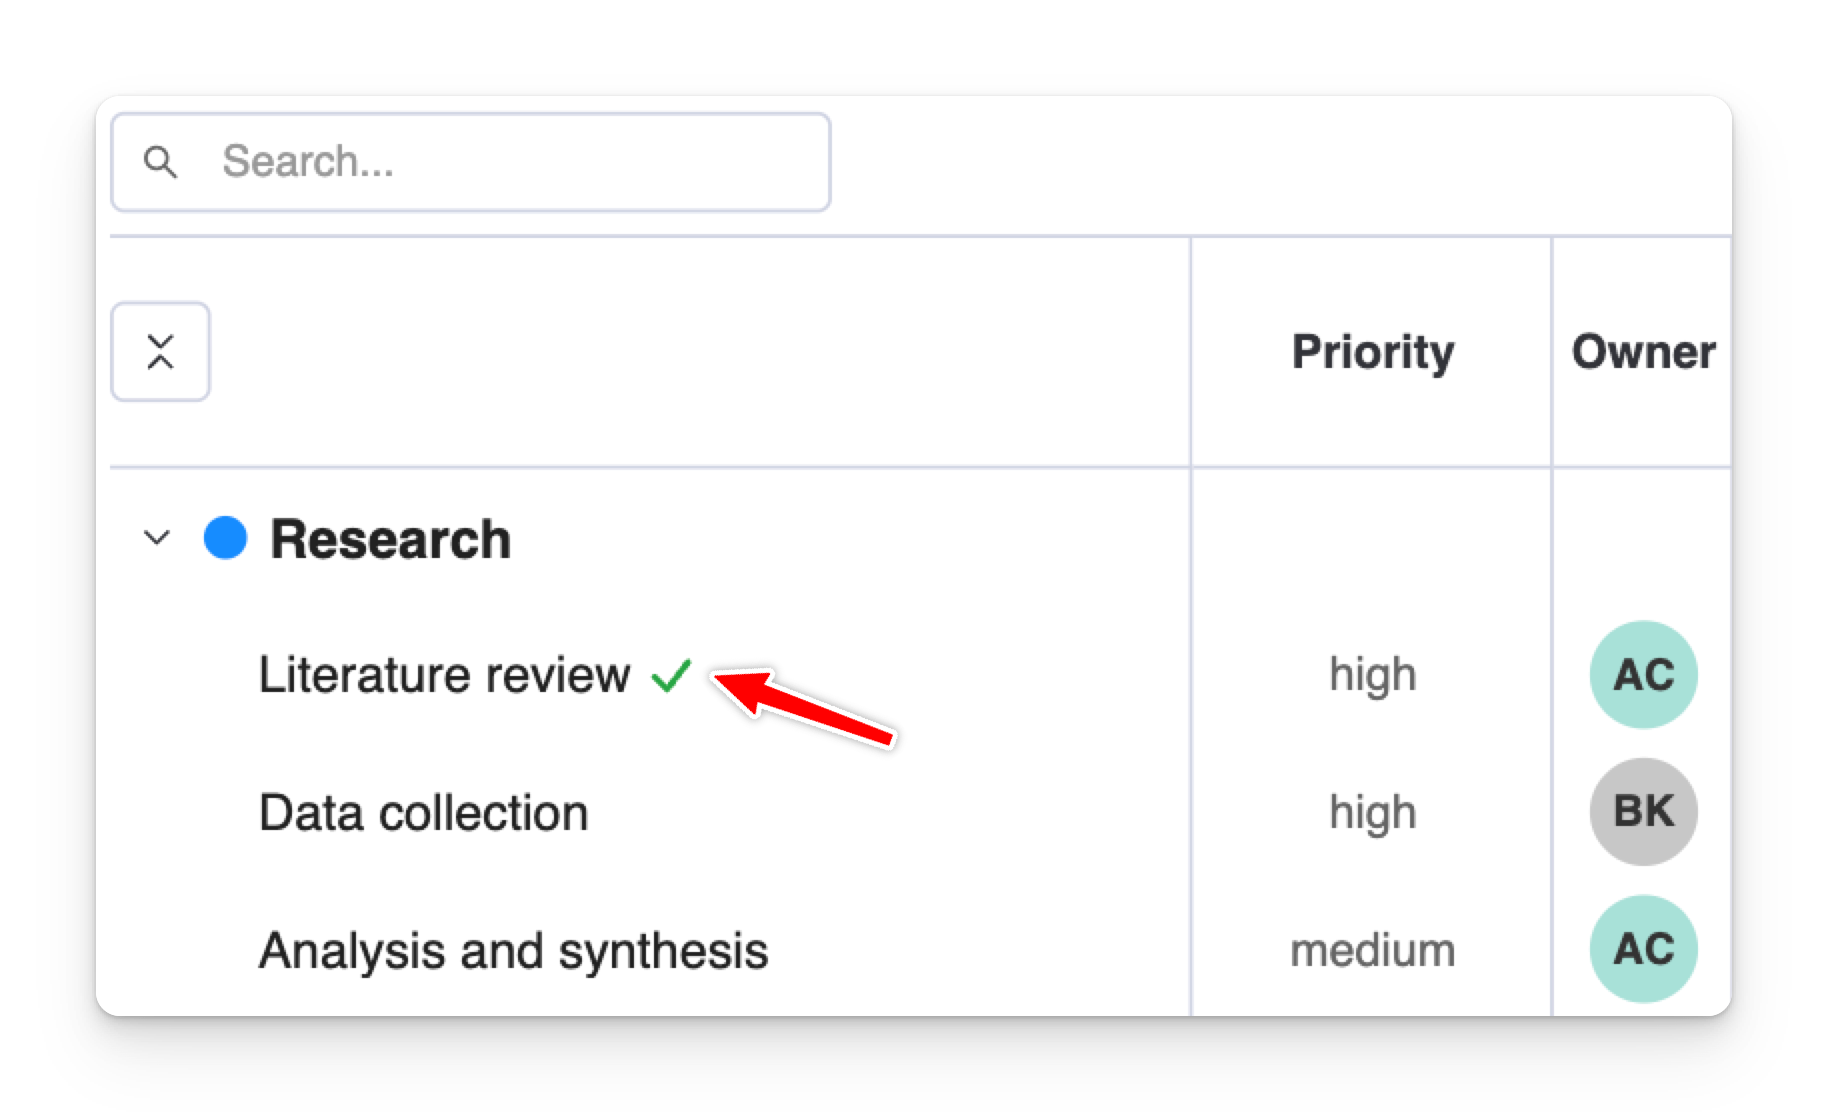
Completion checkmarks
Format → Project hierarchy → Show completion checkmarks
Shows a green checkmark next to tasks that are 100% complete (requires a Progress bar field). On by default.
Milestones
Milestones are key dates plotted as markers on a task's row. Add one to five date columns to the Task milestones field (see Fields → Task milestones).
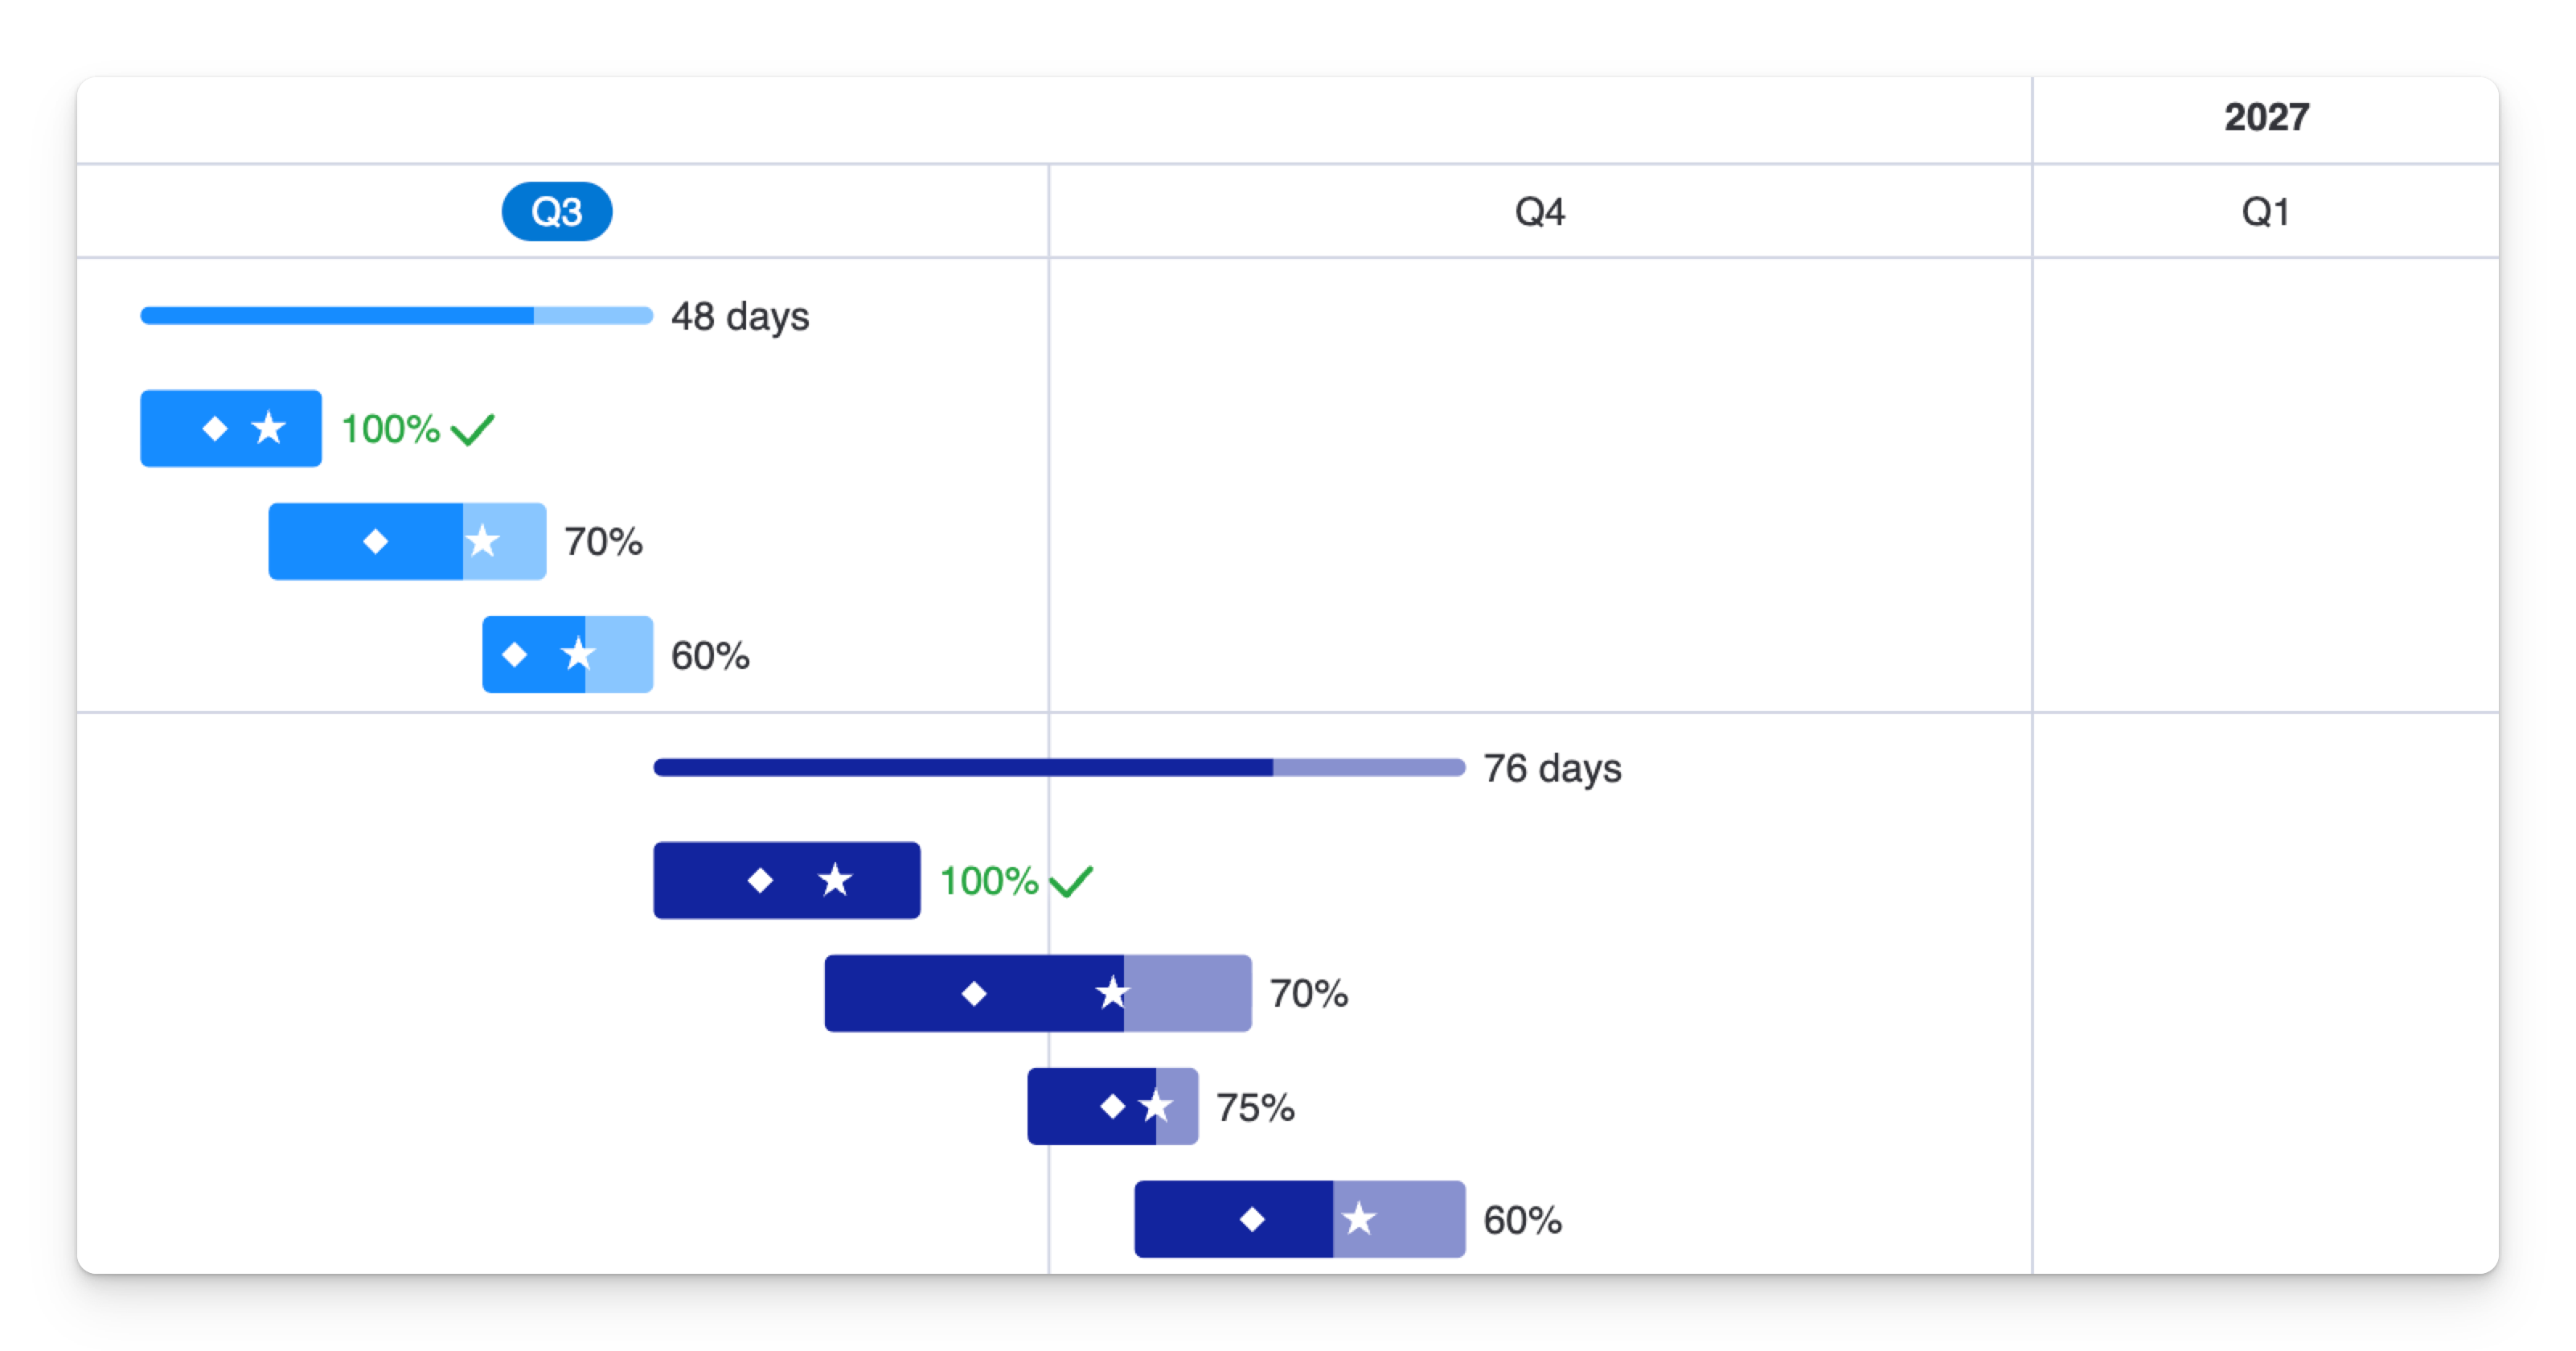
Choose a symbol per milestone
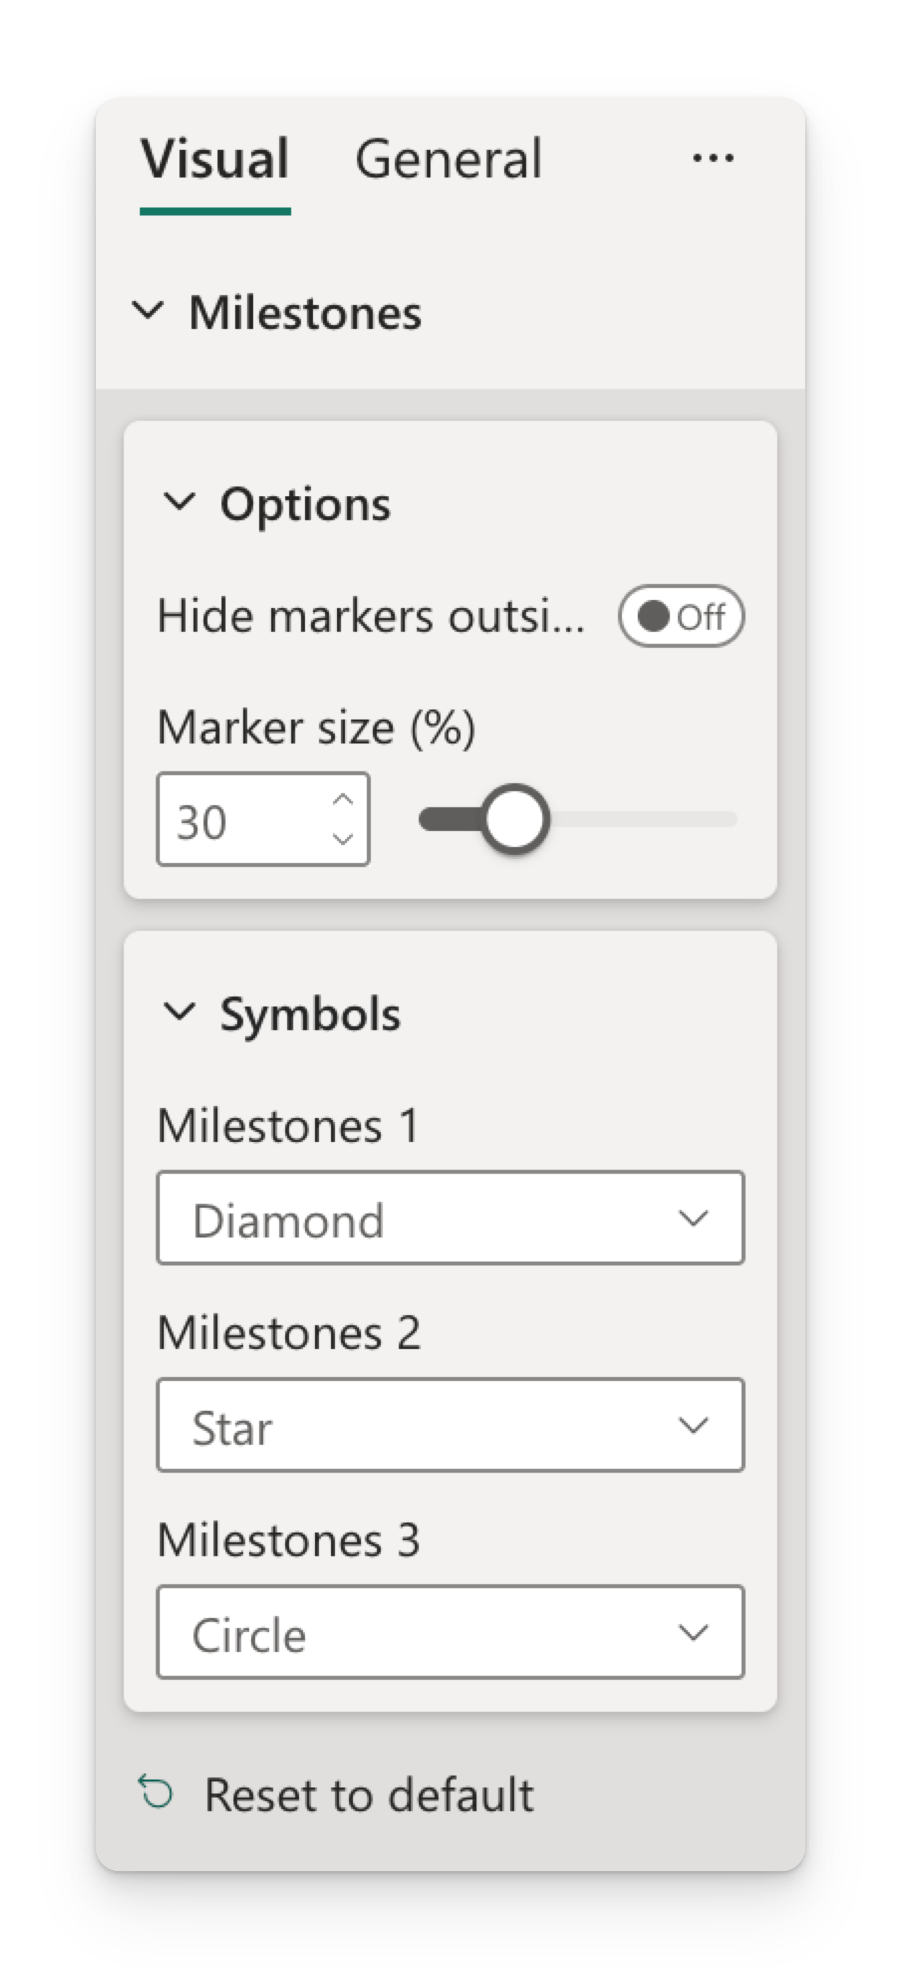
Format → Milestones → Symbols
Each milestone column gets its own symbol picker. Available symbols: Circle · Diamond · Square · Triangle · Star. This lets you distinguish, say, a "Review" milestone (diamond) from a "Go-live" milestone (star).
Zero-duration tasks
A task whose start and end dates are the same has nothing to draw as a bar. By default the visual draws it as a milestone marker instead, so single-day events in your task table appear as milestones without needing a separate Task milestones column.
Format → Milestones → Options
| Setting | What it does | Default |
|---|---|---|
| Zero-duration tasks as milestones | Draws same-day tasks as a marker rather than a bar. | On |
| Task milestone symbol | The shape used for those tasks. | Diamond |
Turn the toggle off if you'd rather these tasks stay as (very short) bars.
Marker options
Format → Milestones → Options
| Setting | What it does | Default |
|---|---|---|
| Hide markers outside bars | Hides milestone markers that fall outside their task's start–end range. | Off |
| Marker size (%) | Size of markers as a percentage of task bar height (10–80%). | 30% |
Dependencies
Dependency arrows show that one task can't start until another finishes. They require two fields: Task ID and Predecessor ID.
Set it up
- Add a unique identifier column to Task ID (e.g.
1,2,3). - Add the predecessor column to Predecessor ID. Each value lists the IDs this task depends on, separated by commas or semicolons.
| Task ID | Task | Predecessor ID |
|---|---|---|
| 1 | Discovery | |
| 2 | Design | 1 |
| 3 | Build | 2 |
| 4 | Launch | 2;3 |
Here "Launch" depends on both "Design" (2) and "Build" (3), so it receives an arrow from each.
Style the arrows
Format → Dependency lines
| Setting | What it does | Default |
|---|---|---|
| Show | Turns dependency arrows on or off. | On |
| Color | Arrow color. | #323338 (dark gray) |
| Style | Solid, Dashed, or Dotted. | Solid |
| Width | Arrow line thickness, 1–5 px. | 1 px |
Arrows only appear when both Task ID and Predecessor ID are populated and the IDs match. If an arrow is missing, check that the predecessor value exactly matches an existing Task ID and that IDs are unique.
Related
- Progress, colors, labels → Progress, colors & appearance
- Every setting in one place → Formatting reference