Gantt Chart
The Gantt Chart by ChartPad is a custom Power BI visual for turning project data into a clear, interactive schedule. Each task becomes a horizontal bar positioned on a timeline — its start, end, and duration are visible at a glance — and tasks can be nested into projects and sub-tasks, colored by category, tracked for progress, linked with dependency arrows, and marked with milestones.
It is designed for report authors who want a project-management-grade Gantt inside Power BI, without leaving the report or writing any code.
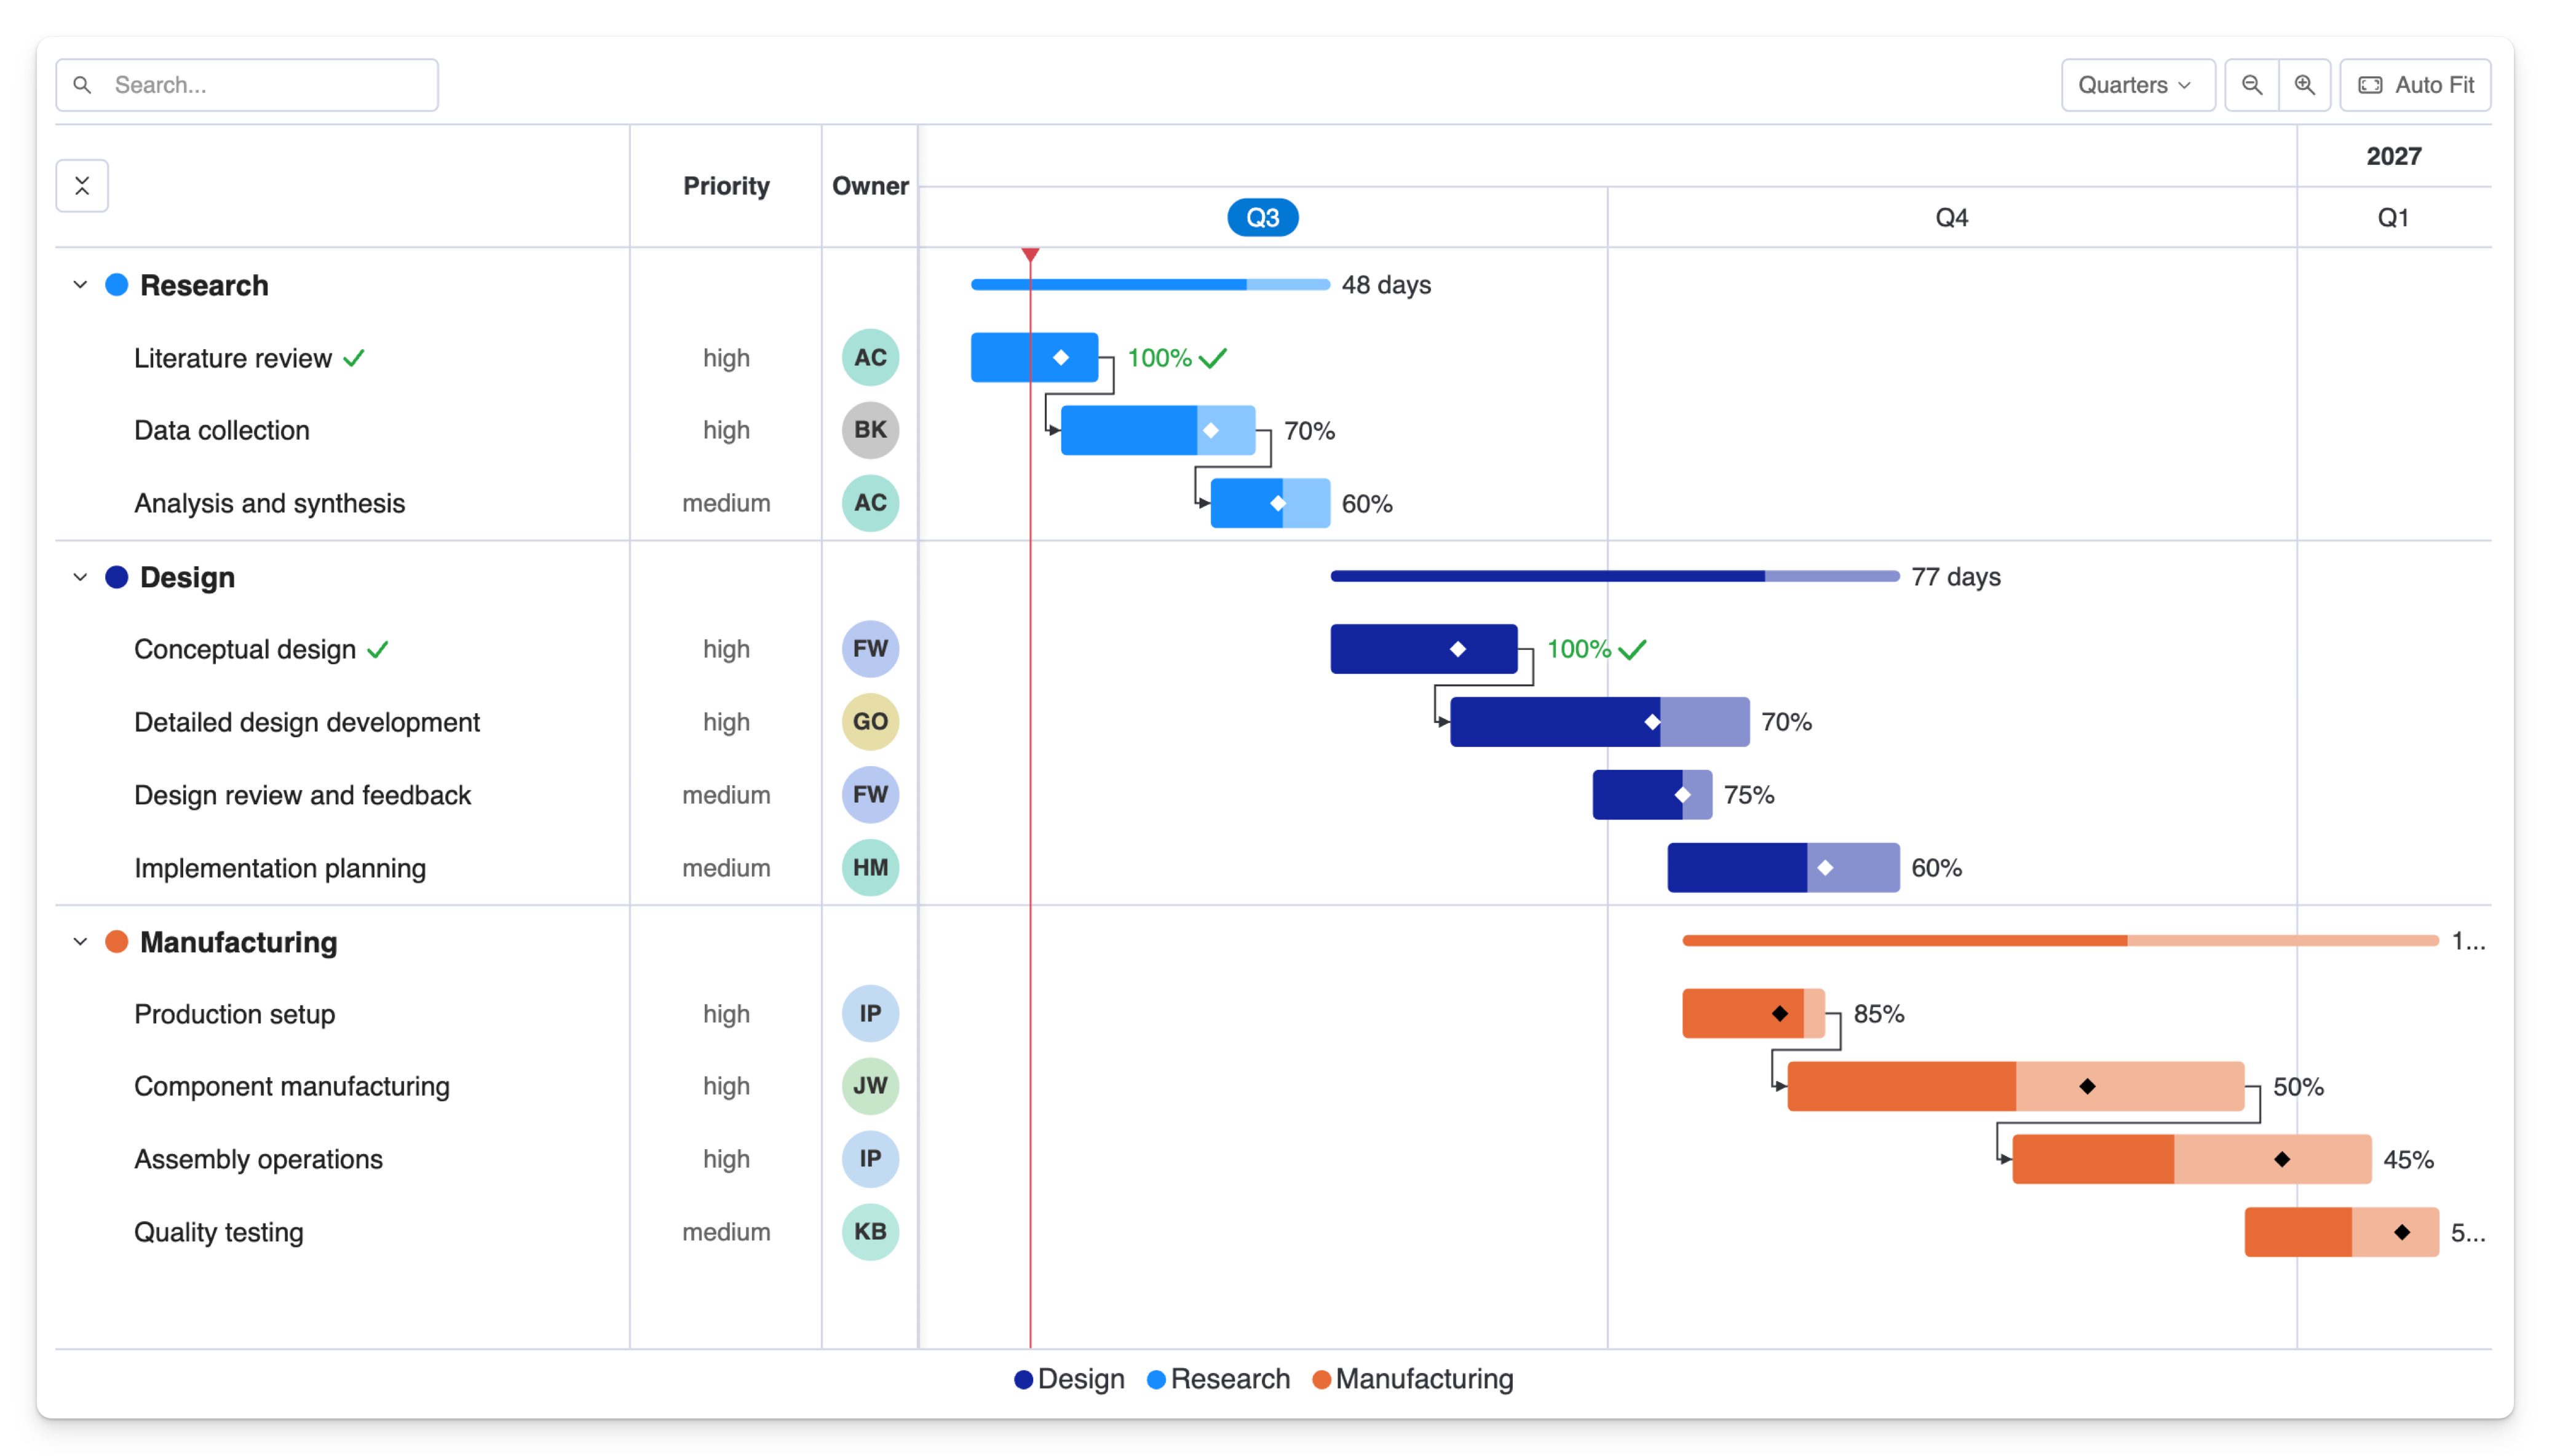
What it can do
- Task hierarchy — nest tasks up to 10 levels deep (project → task → sub-task) with expand/collapse and automatic summary bars.
- Timeline & zoom — switch between Day, Week, Month, Quarter, Year, or Auto Fit; scroll to Start, Today, or End on load.
- Progress tracking — show actual vs. planned progress, a progress percentage, and completion checkmarks.
- Milestones — plot up to 5 date columns per task using circles, diamonds, squares, triangles, or stars.
- Dependencies — draw arrows between tasks from a predecessor list.
- Owners — display who owns each task as initials in a colored circle.
- Extra columns & tooltips — surface additional data next to the task list or on hover.
- Styling — control colors, bar sizes, labels, fonts, grid lines, a Today line, a legend, and a built-in dark mode.
- Accessible — full keyboard navigation and screen reader support, respects Power BI's high-contrast mode, and ships in 12 languages.
The Gantt Chart is a Microsoft-certified Power BI visual: its code has been reviewed and tested to confirm it doesn't access any external services, so your data never leaves Power BI. Certified visuals are safe for enterprise use and support export to PowerPoint/PDF and email subscriptions. See Certified by Microsoft.
Anatomy of the chart
The visual is split into a task list on the left and a timeline on the right, joined by an optional band of extra columns and owner circles.
| Region | What it shows |
|---|---|
| Top bar | Search box and zoom controls (can be hidden). |
| Task list | The project → task → sub-task hierarchy, with expand/collapse, optional WBS row numbers, color swatches, and completion checkmarks. |
| Extra columns | Up to three additional data columns shown between the task list and the timeline. |
| Owner circles | Task owner shown as initials in a colored circle. |
| Timeline | A two-level date header and the task/summary bars, milestones, progress, dependency arrows, and the Today line. |
| Legend | Optional legend describing the color categories. |
How to read it
- A bar's horizontal position is its start date; its length is its duration (start → end).
- A thin summary bar spans all of a parent's children.
- A filled portion of a bar shows how complete the task is.
- A marker on or near a bar is a milestone (a key date).
- An arrow from one bar to another means the second task depends on the first.
- The vertical Today line marks the current date.
Before you start
The Gantt Chart is free to try — every feature works during evaluation. To use it in a published report without an on-visual license notice, each editor and viewer needs a license (a 30-day free trial is available). See Licensing & support for details.
Next steps
- Getting started — install the visual and build your first Gantt in five steps.
- Fields — learn what each data field does.
- Formatting reference — every setting, explained.