Getting started
This page walks you from an empty report to a working Gantt Chart. No prior experience with custom visuals is required.
1. Add the visual to Power BI
The Gantt Chart is distributed through Microsoft AppSource, the marketplace built into Power BI. You can view the listing here: ChartPad Gantt Chart on AppSource.
- In Power BI Desktop (or the Power BI service), open the report you want to add the visual to.
- In the Visualizations pane, select the ⋯ (Get more visuals) button.
- Search for ChartPad Gantt Chart.
- Select Add. The Gantt Chart icon appears at the bottom of your Visualizations pane.
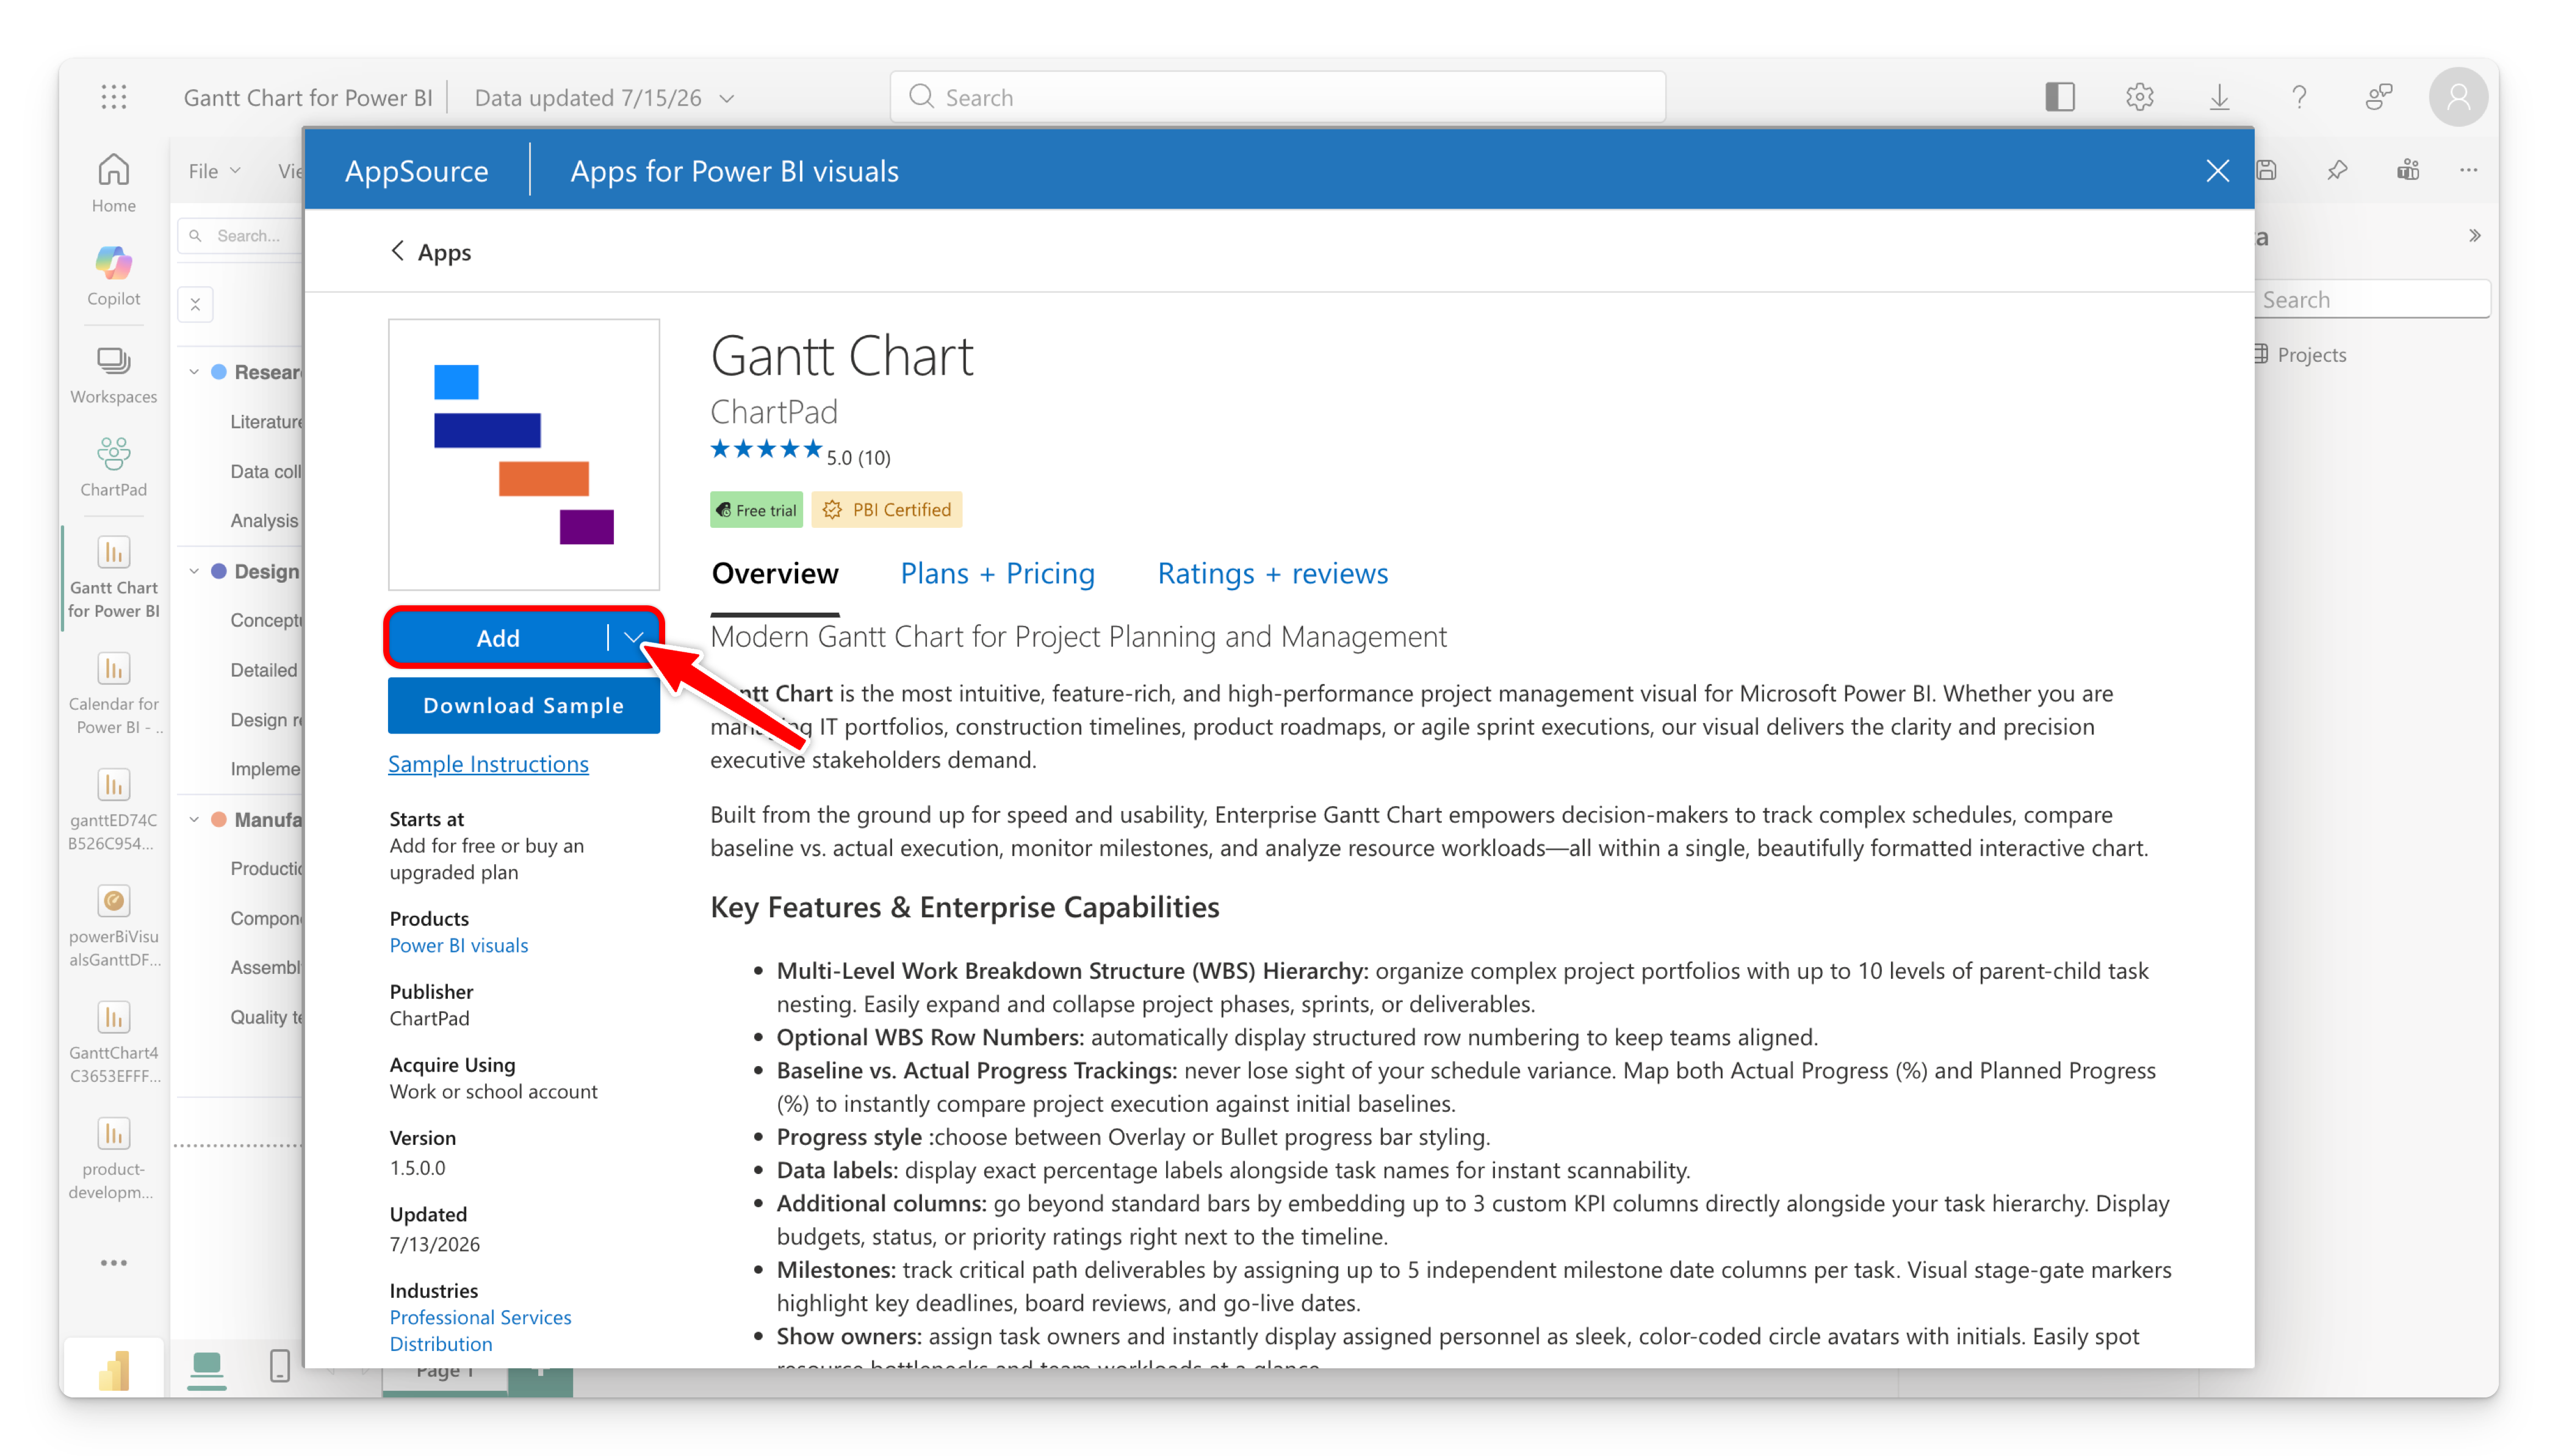
The Gantt Chart is a Microsoft-certified visual, so it shows a blue Certified badge in Power BI. When browsing "Get more visuals", you can turn on the Power BI Certified filter to find it (and other certified visuals) quickly. See Certified by Microsoft below for what this means.
Your organization may restrict AppSource. If you can't add visuals, ask your Power BI administrator to allow the ChartPad Gantt Chart, or to import it as an organizational visual.
Certified by Microsoft
The ChartPad Gantt Chart is a Microsoft-certified Power BI visual. Certification means Microsoft has reviewed and tested the visual's code and confirmed that it does not access any external services or resources — your data stays inside Power BI and never leaves your tenant.
For report authors, certification brings practical benefits:
- Safe for enterprise and regulated environments — because nothing is sent to outside services, the visual is suitable for organizations with strict data-governance requirements.
- Export to PowerPoint and PDF — reports using the Gantt Chart export correctly to PowerPoint and PDF.
- Email subscriptions — the visual renders in the images delivered when users subscribe to report pages.
- Easy to find — use the Power BI Certified filter in "Get more visuals" to locate it.
You'll see a yellow PBI Certified badge on the AppSource listing and a blue Certified badge inside Power BI.
2. Place it on the canvas
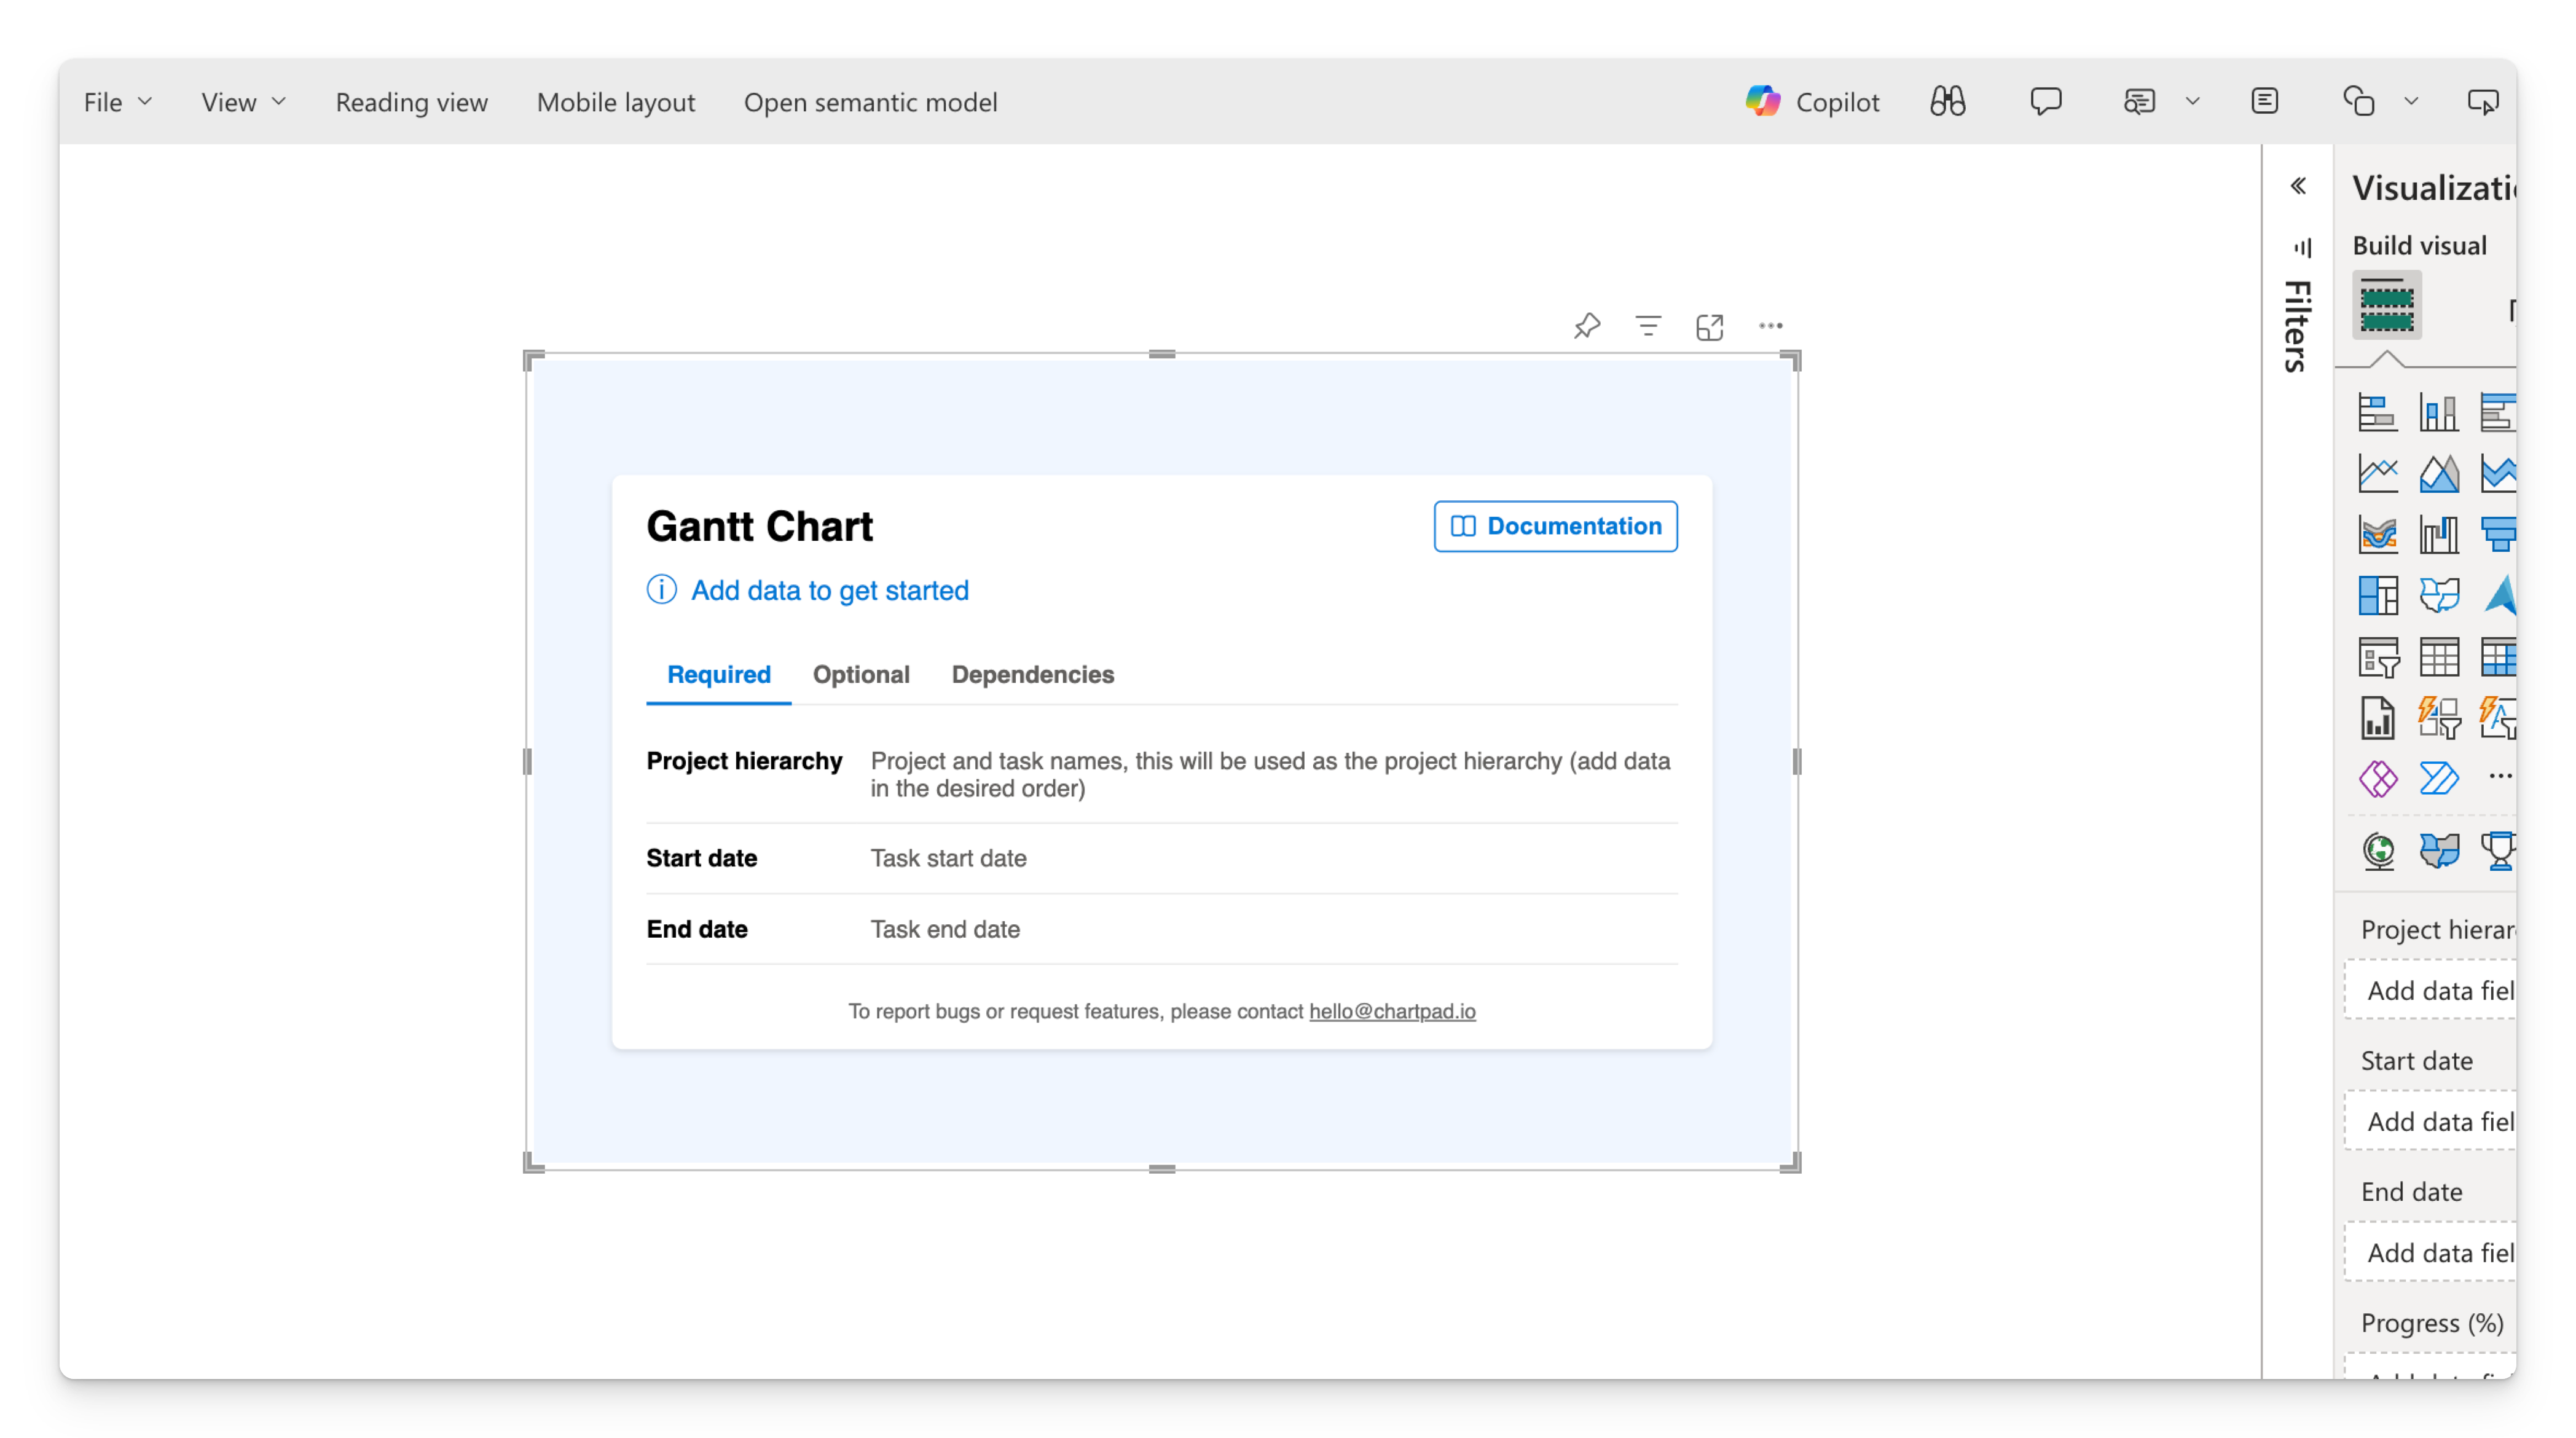
Select the Gantt Chart icon in the Visualizations pane. An empty visual is added to your report canvas, showing a landing page that lists the fields you can add.
The landing page has three tabs:
- Required — the three fields the chart needs to draw anything: Project hierarchy, Start date, and End date.
- Optional — everything else: progress, legend, milestones, extra columns, owner, and tooltips.
- Dependencies — the two fields used to draw dependency arrows: Task ID and Predecessor ID.
3. Prepare your data
The Gantt Chart expects one row per task. At minimum you need a task name, a start date, and an end date. Here is a small sample you can reproduce:
| Project | Task | Start | Finish |
|---|---|---|---|
| Website relaunch | Discovery | 2026-01-05 | 2026-01-16 |
| Website relaunch | Design | 2026-01-19 | 2026-02-13 |
| Website relaunch | Build | 2026-02-16 | 2026-03-27 |
| Website relaunch | Launch | 2026-03-30 | 2026-04-03 |
Start and Finish must be a Date or Date/Time data type in your model — not text. If they show up as text, change the column type in Power Query or the model view first.
4. Assign required fields
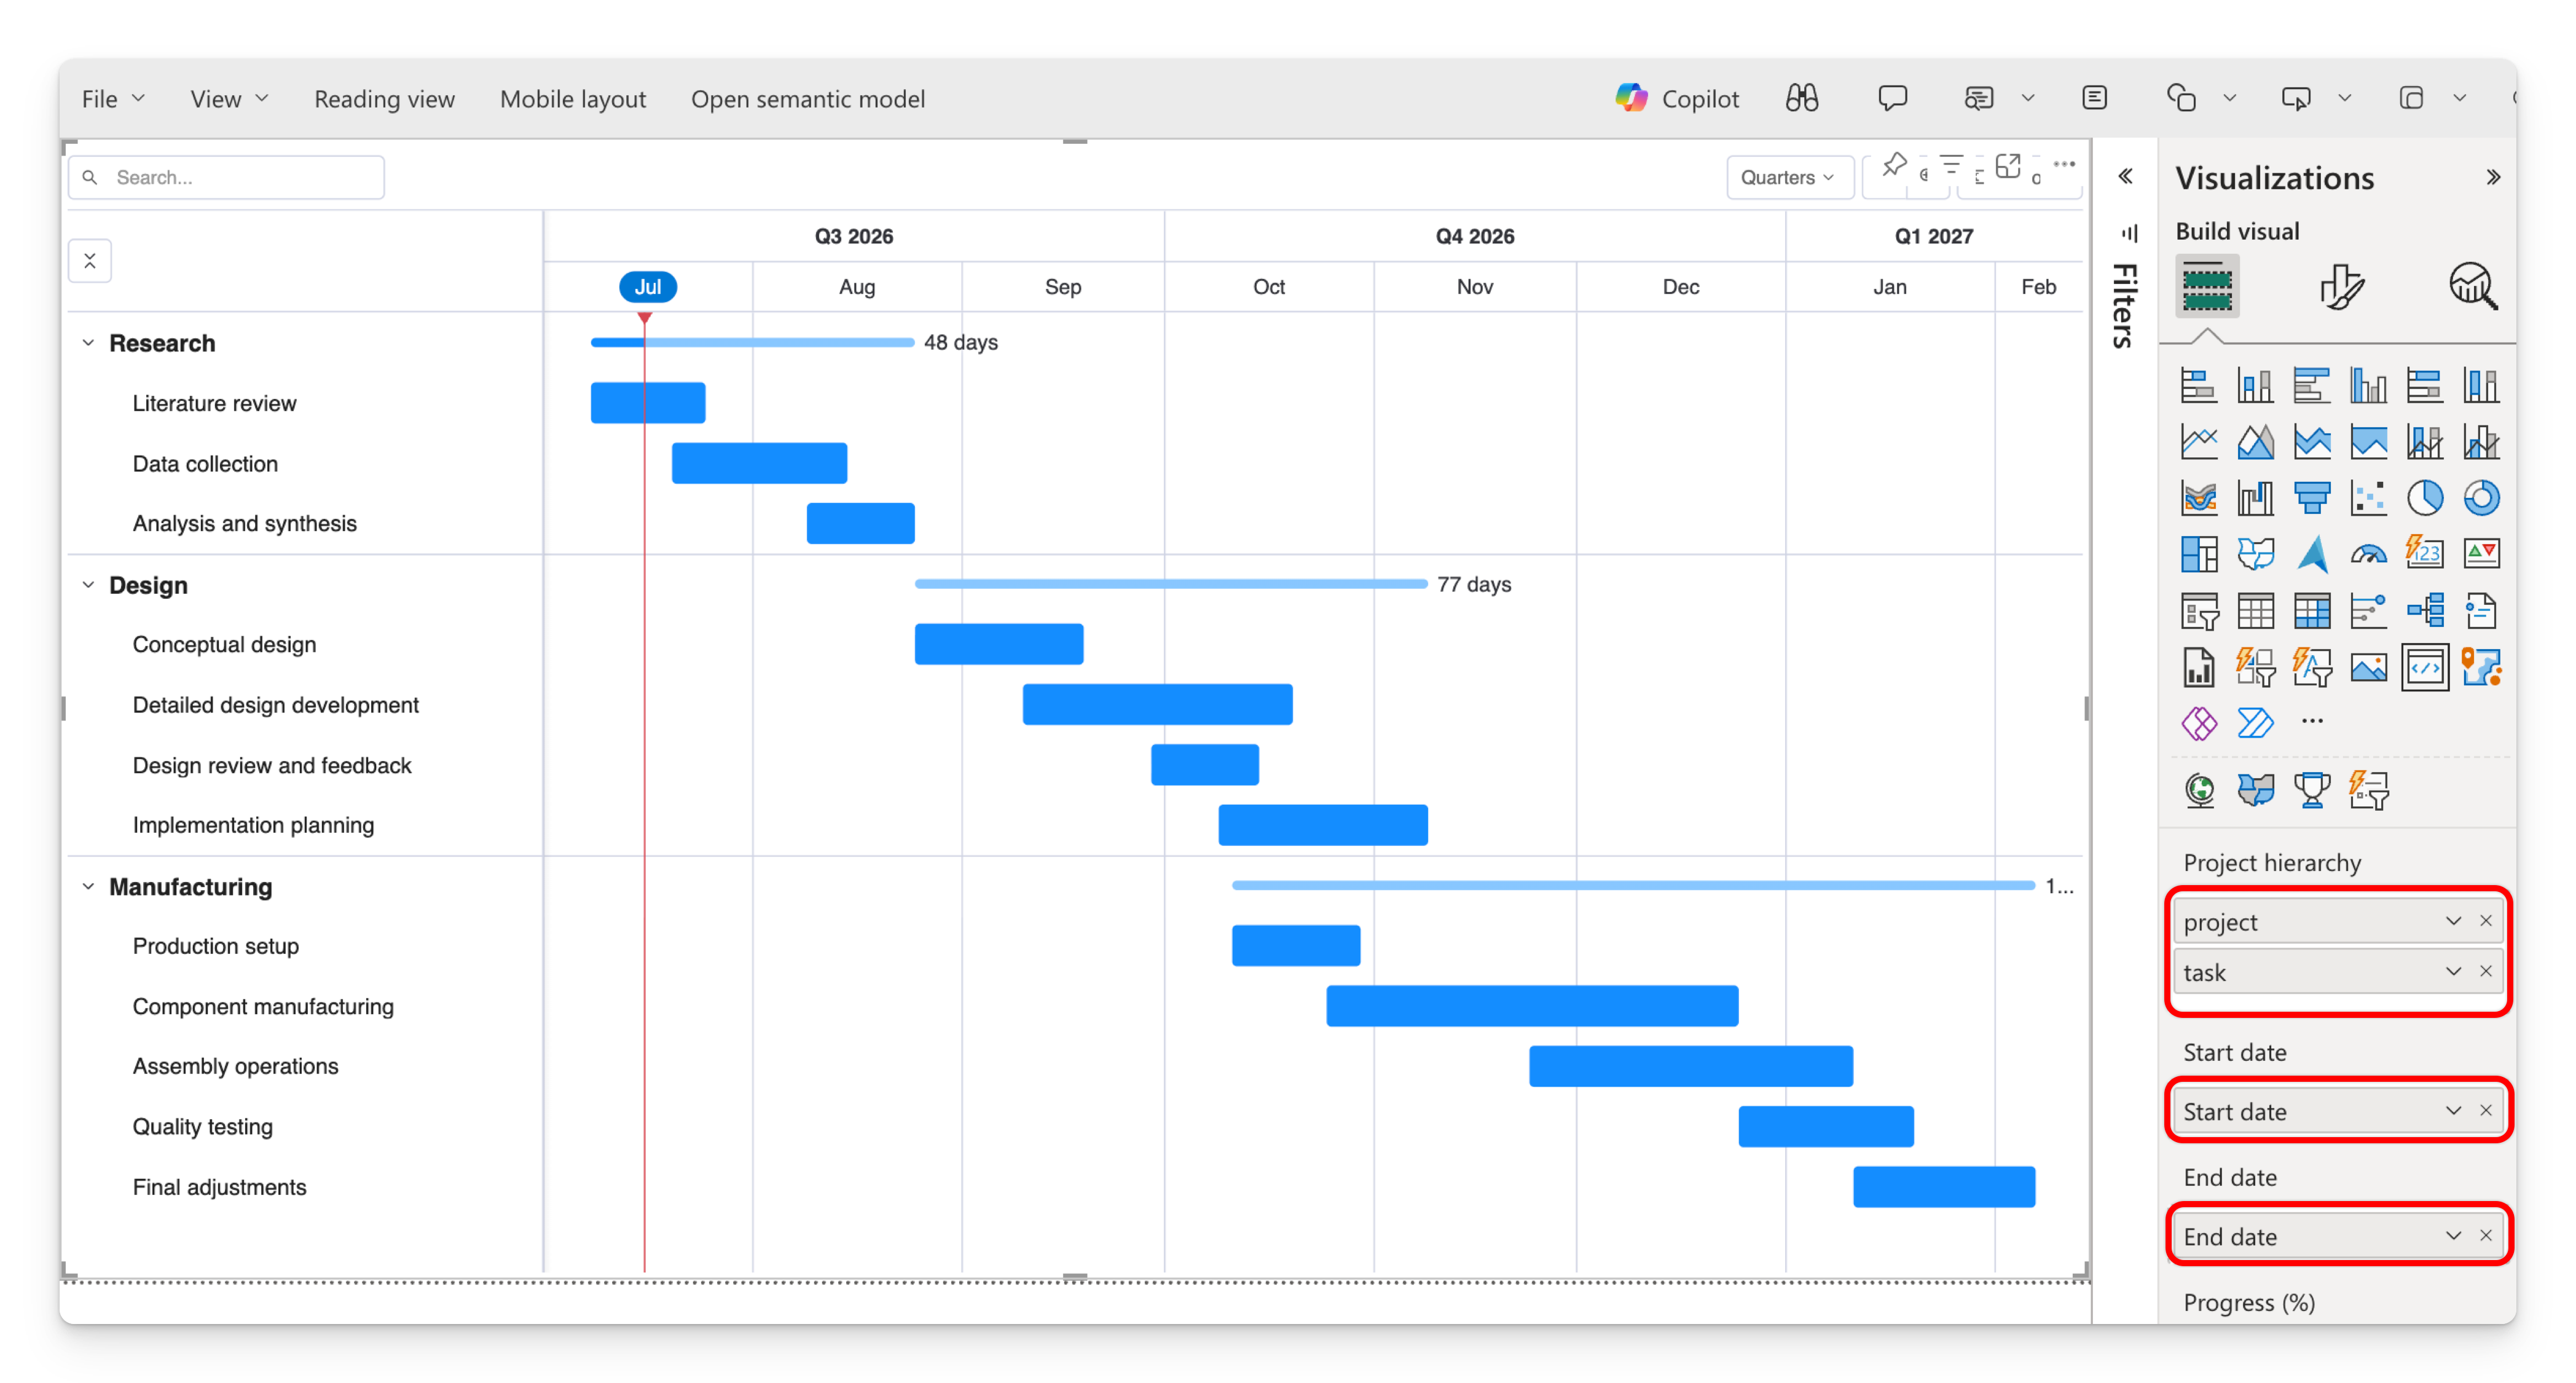
With the visual selected, drag your columns into these three data fields:
- Project hierarchy ←
Project, thenTask. The order matters: the first column is the top level of the hierarchy, the next column nests underneath it. (See Fields → Project hierarchy.) - Start date ←
Start. - End date ←
Finish.
As soon as all three are populated, the landing page disappears and your Gantt renders.
5. Add optional details
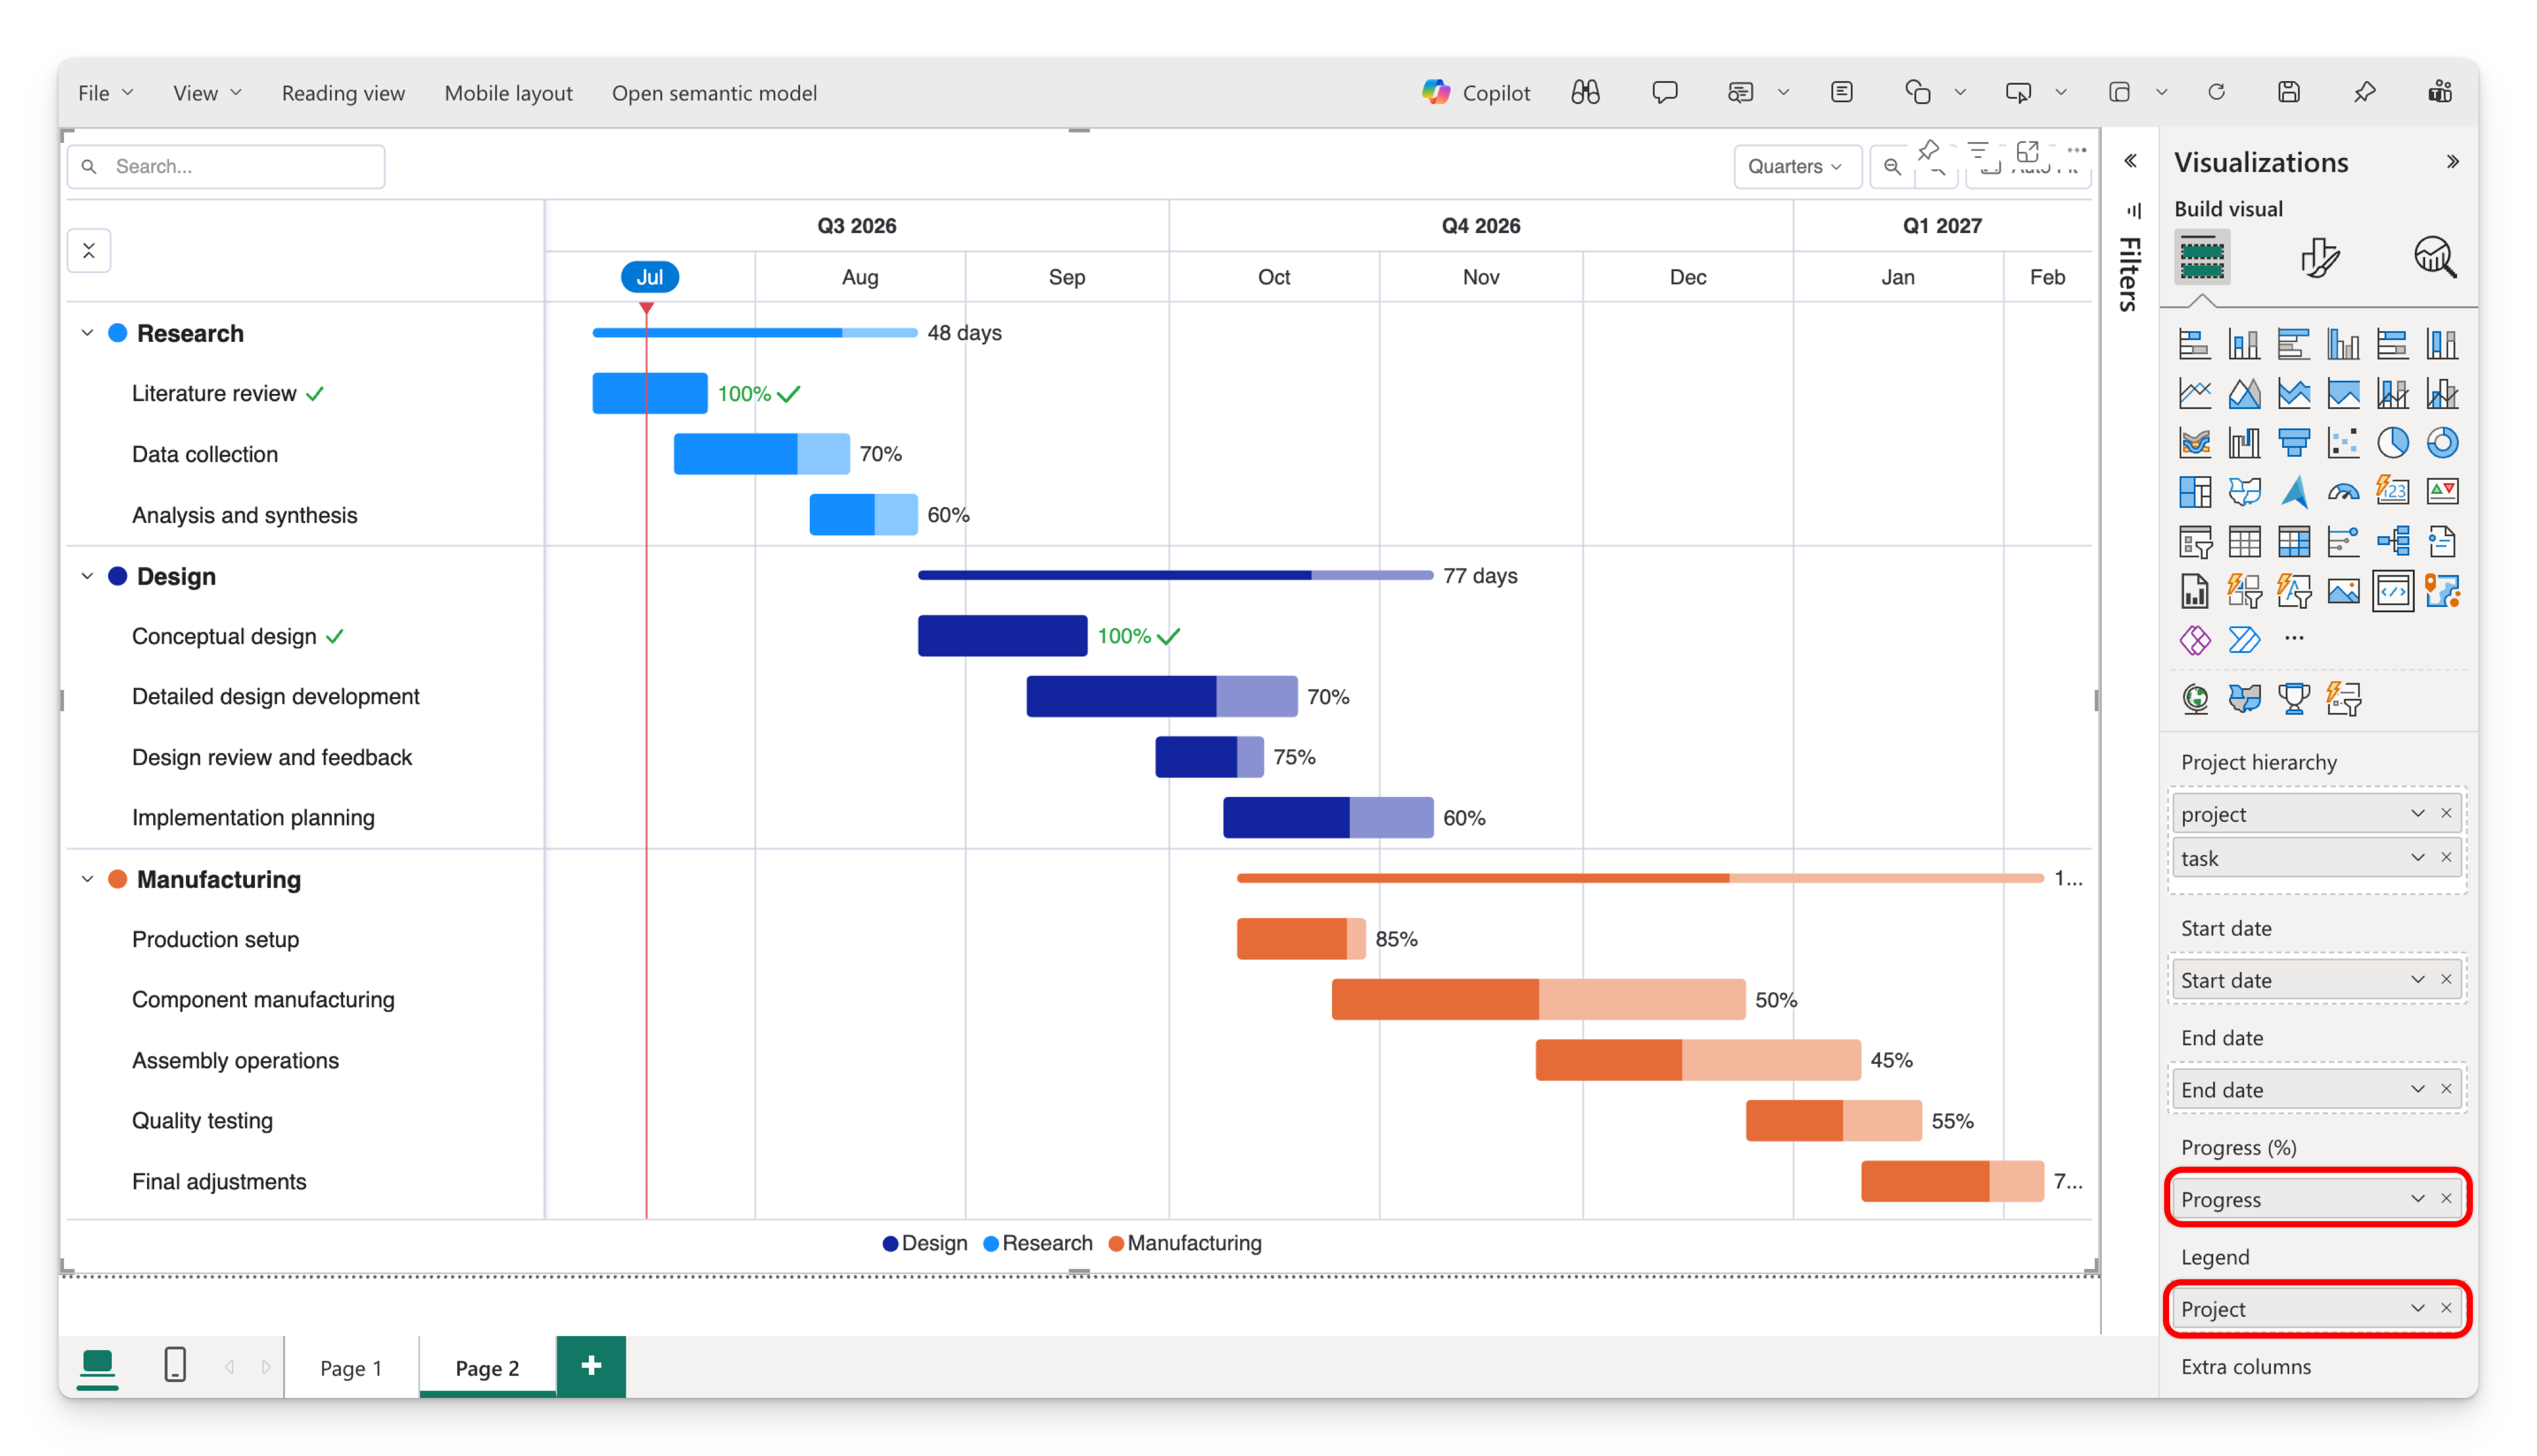
Now enrich the chart by dragging in any of the optional fields:
- Progress (%) — a % complete measure (0–100 or 0–1) to fill the bars.
- Legend — a field to color tasks by (e.g. Status or Team).
- Owner — a name column, shown as initials.
- Milestones — one or more date columns to plot as markers.
- Tooltip — extra fields to show on hover.
- URLs — up to three link columns, opened from a link icon in the task list.
See Fields for the full list and what each one does.
6. Sorting tasks
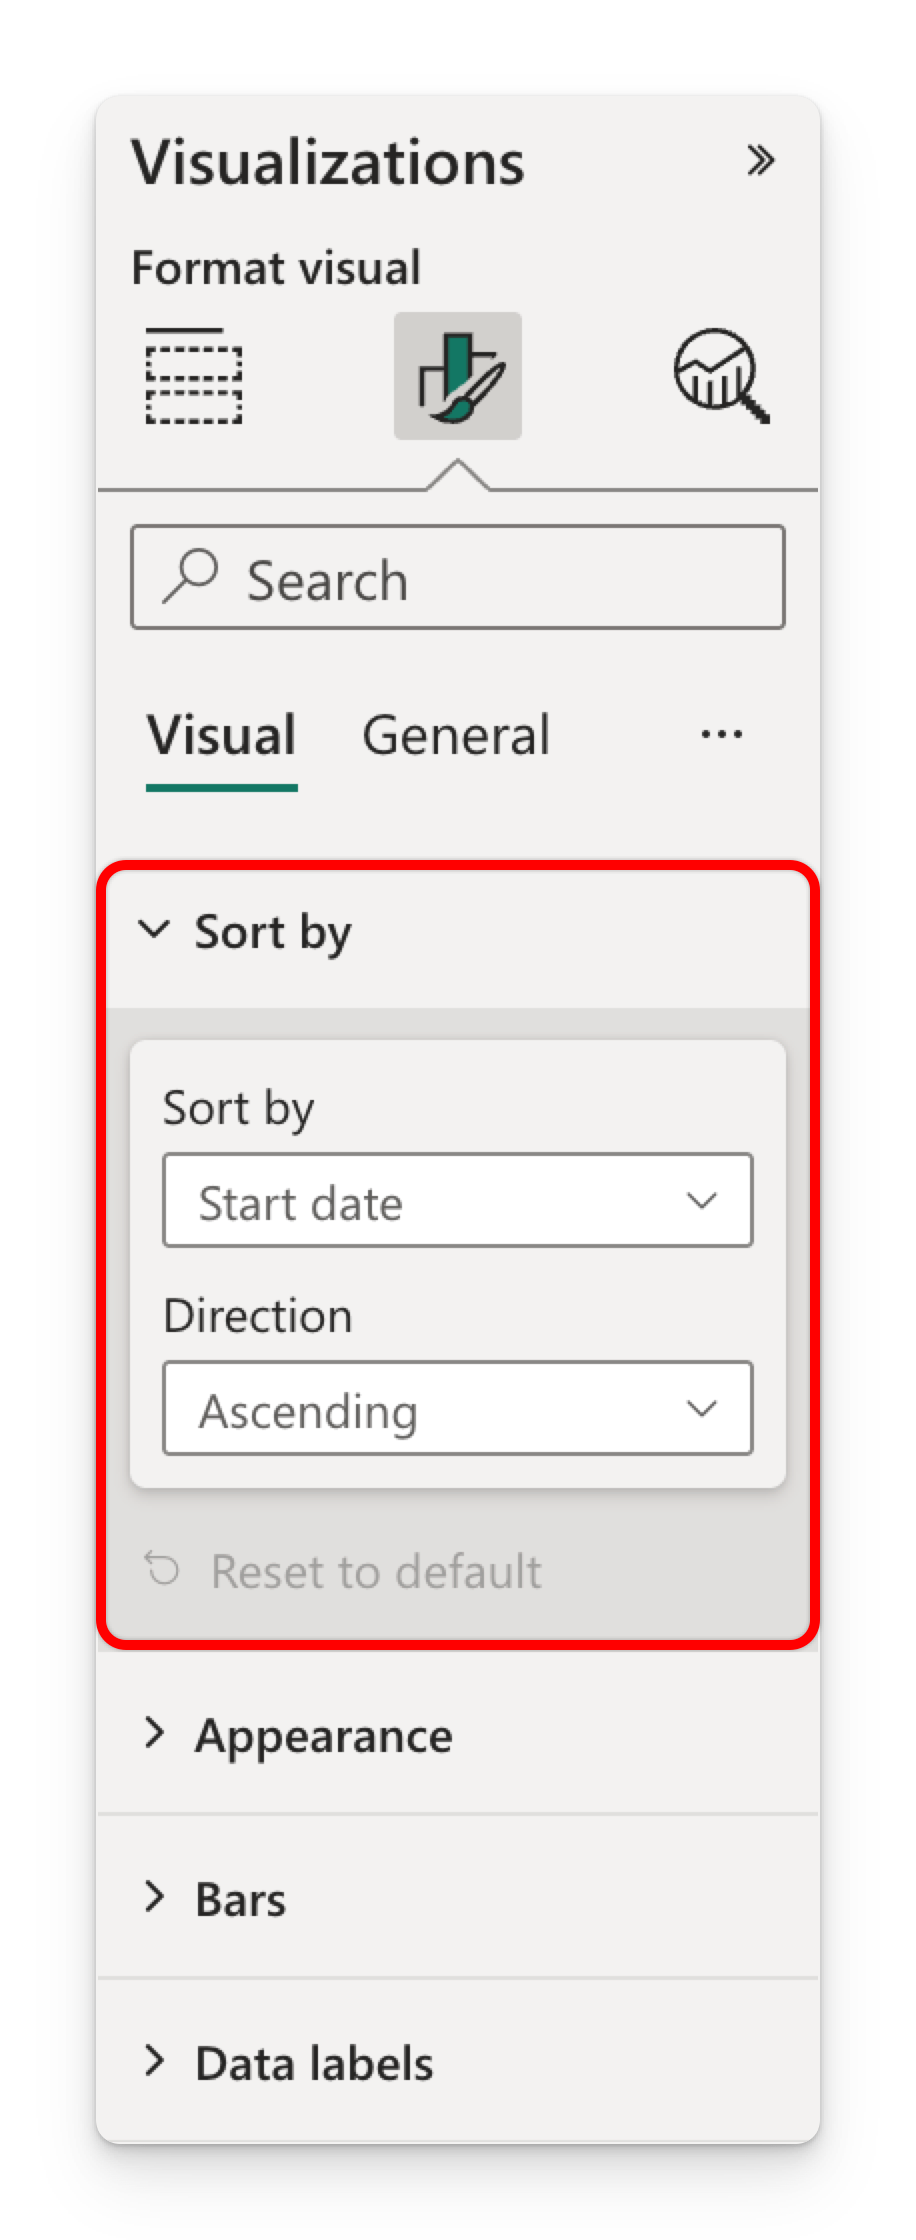
Format → Sort by
By default, projects are sorted by their starting date. You can adjust the sorting based on your needs.
| Setting | Options | Default |
|---|---|---|
| Sort by | Start date · End date · Duration · Task name · Data order | Start date |
| Direction | Ascending · Descending | Ascending |
- Data order keeps the exact row order delivered by Power BI (for example, from the visual header's sort menu or a model "Sort by column").
- Direction is ignored when sorting by Data order.
You're set
You now have a working Gantt Chart. From here:
- Change the time scale and starting position → Timeline & navigation
- Add milestones and dependency arrows → Tasks, milestones & dependencies
- Fine-tune colors, labels, and appearance → Progress, colors & appearance