Data Fields
The Gantt Chart is driven entirely by the fields you drag into its wells. This page explains every field: what it does, whether it's required, how many columns it accepts, and how to shape your data for it.
Only three fields are required — Category, Start date, and End date. Everything else is optional and can be added in any combination.
Field summary
| Field | Required? | Max columns | Purpose |
|---|---|---|---|
| Category | ✅ Yes | 10 | Task / sub-task hierarchy |
| Start date | ✅ Yes | 1 | Task start |
| End date | ✅ Yes | 1 | Task end |
| Progress bar | No | 1 | Actual % complete |
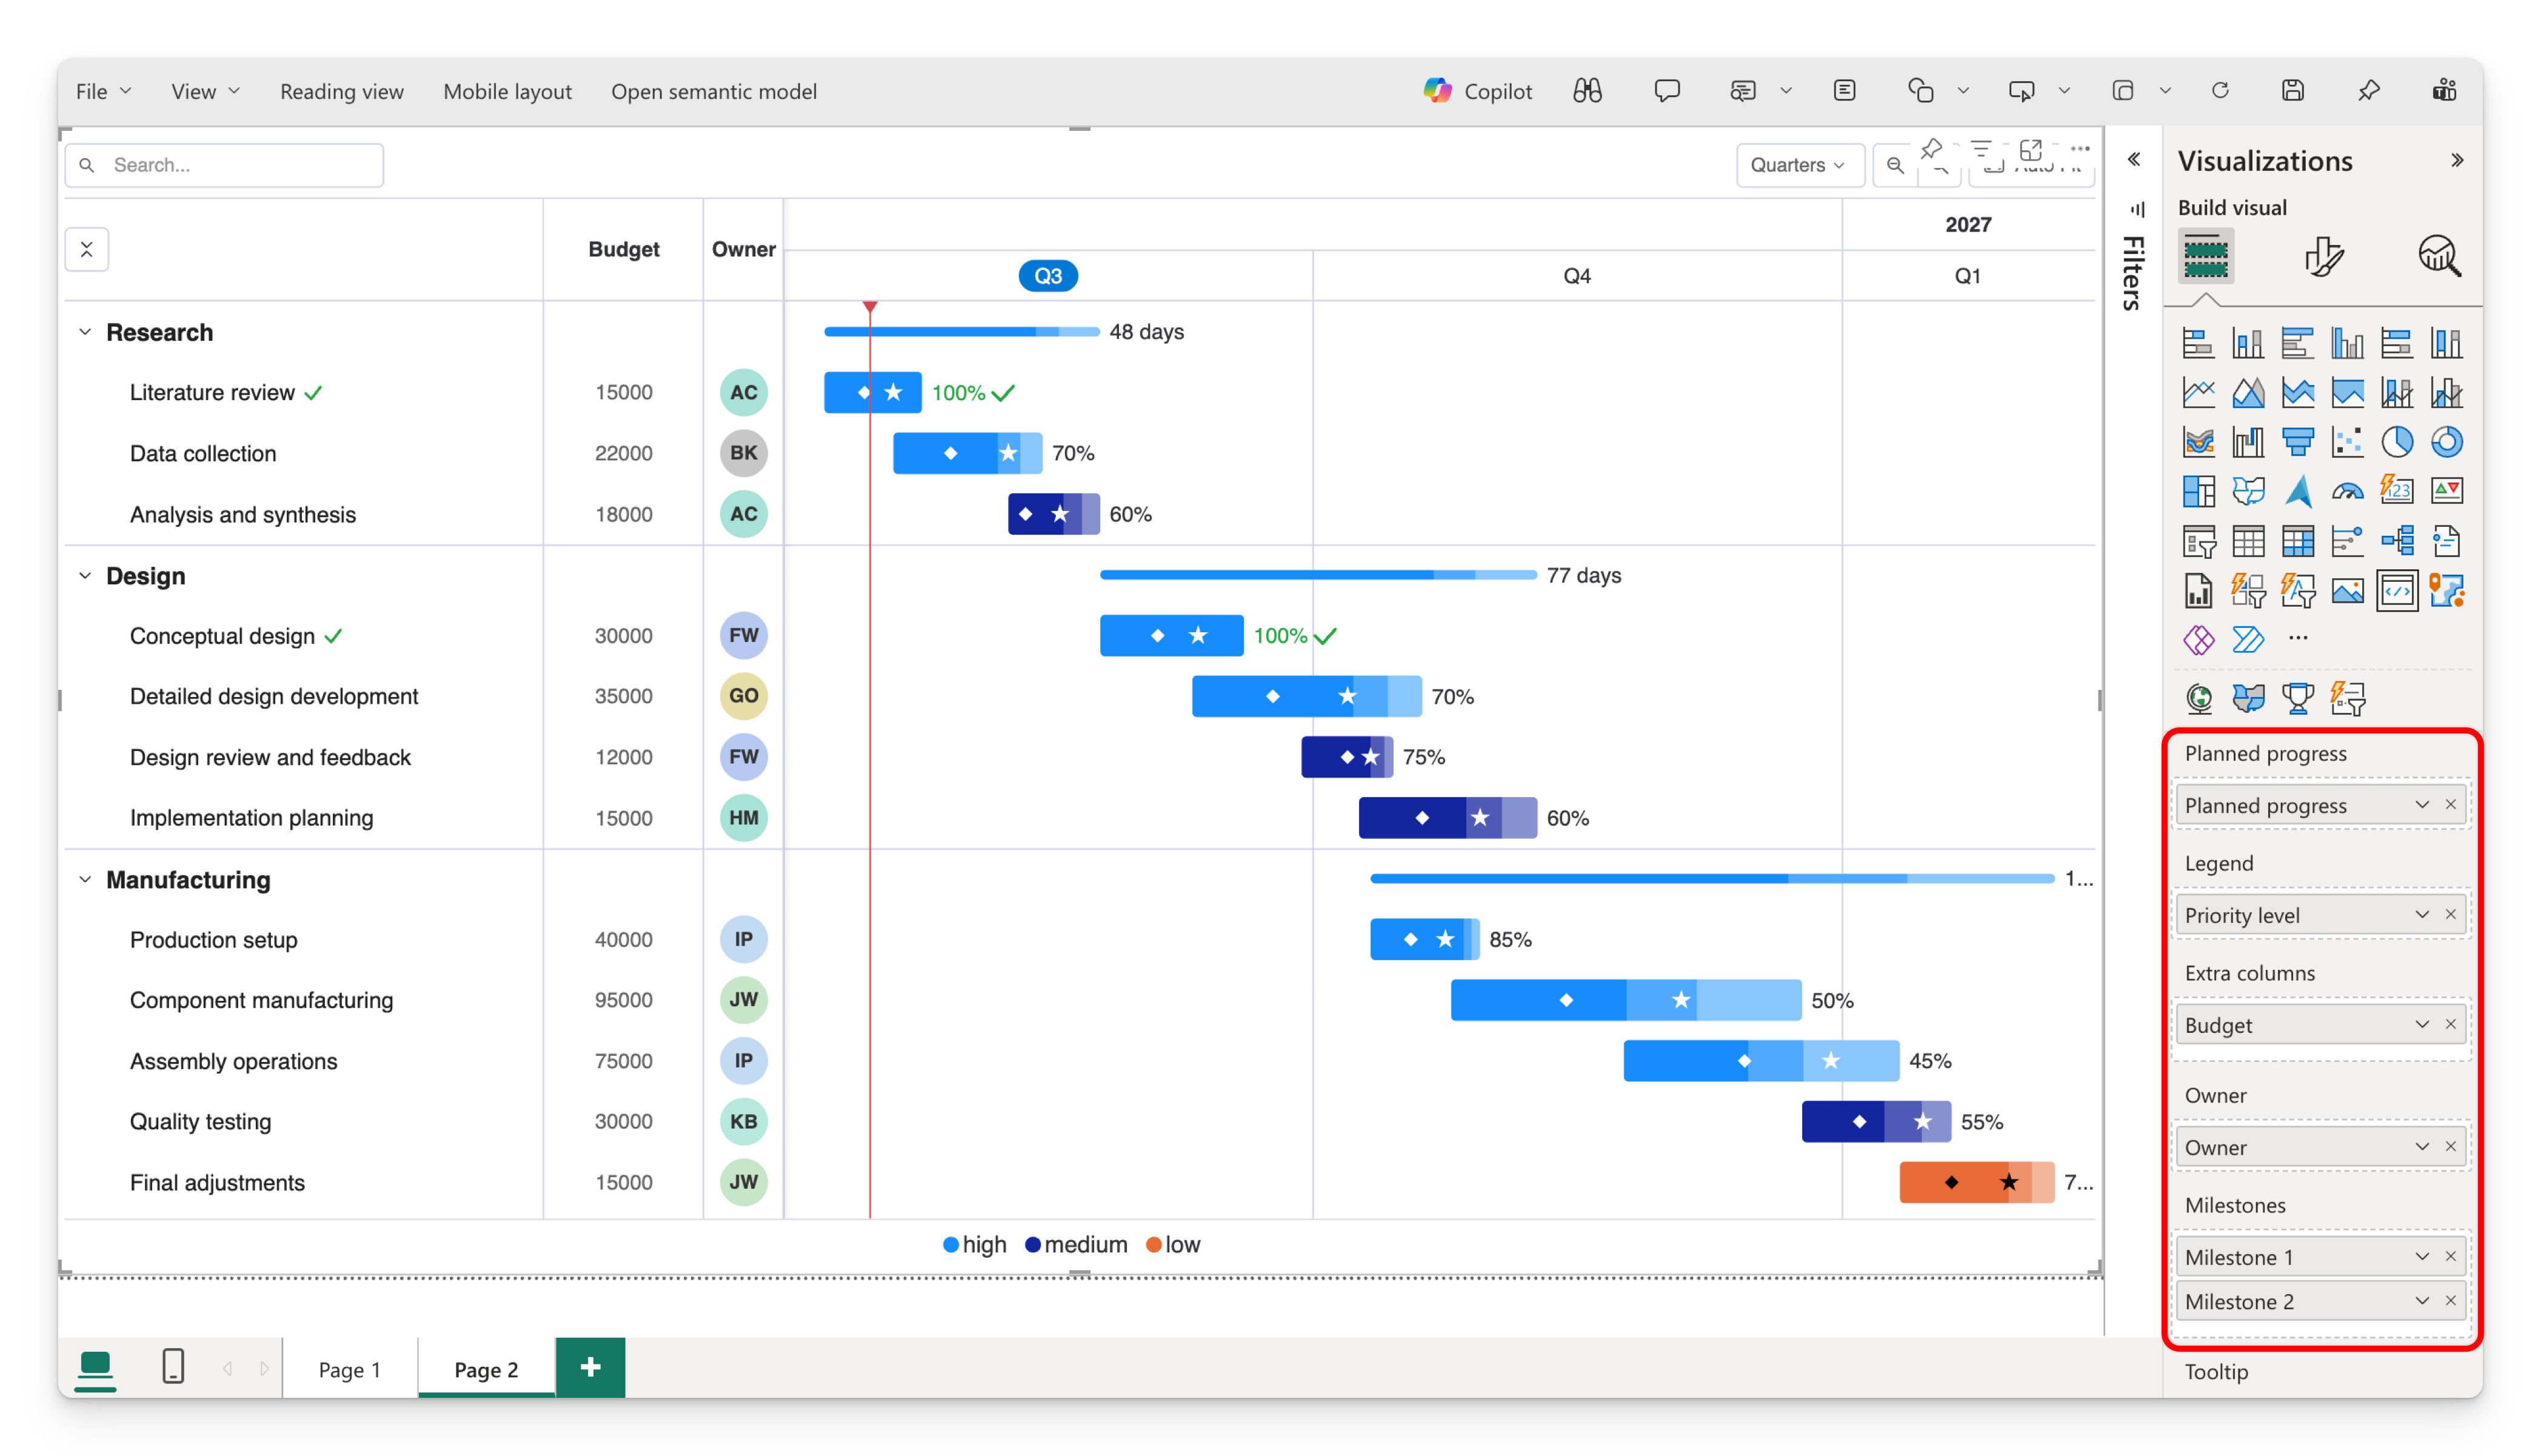
| Planned progress | No | 1 | Planned % complete |
| Legend | No | 1 | Color tasks by this field |
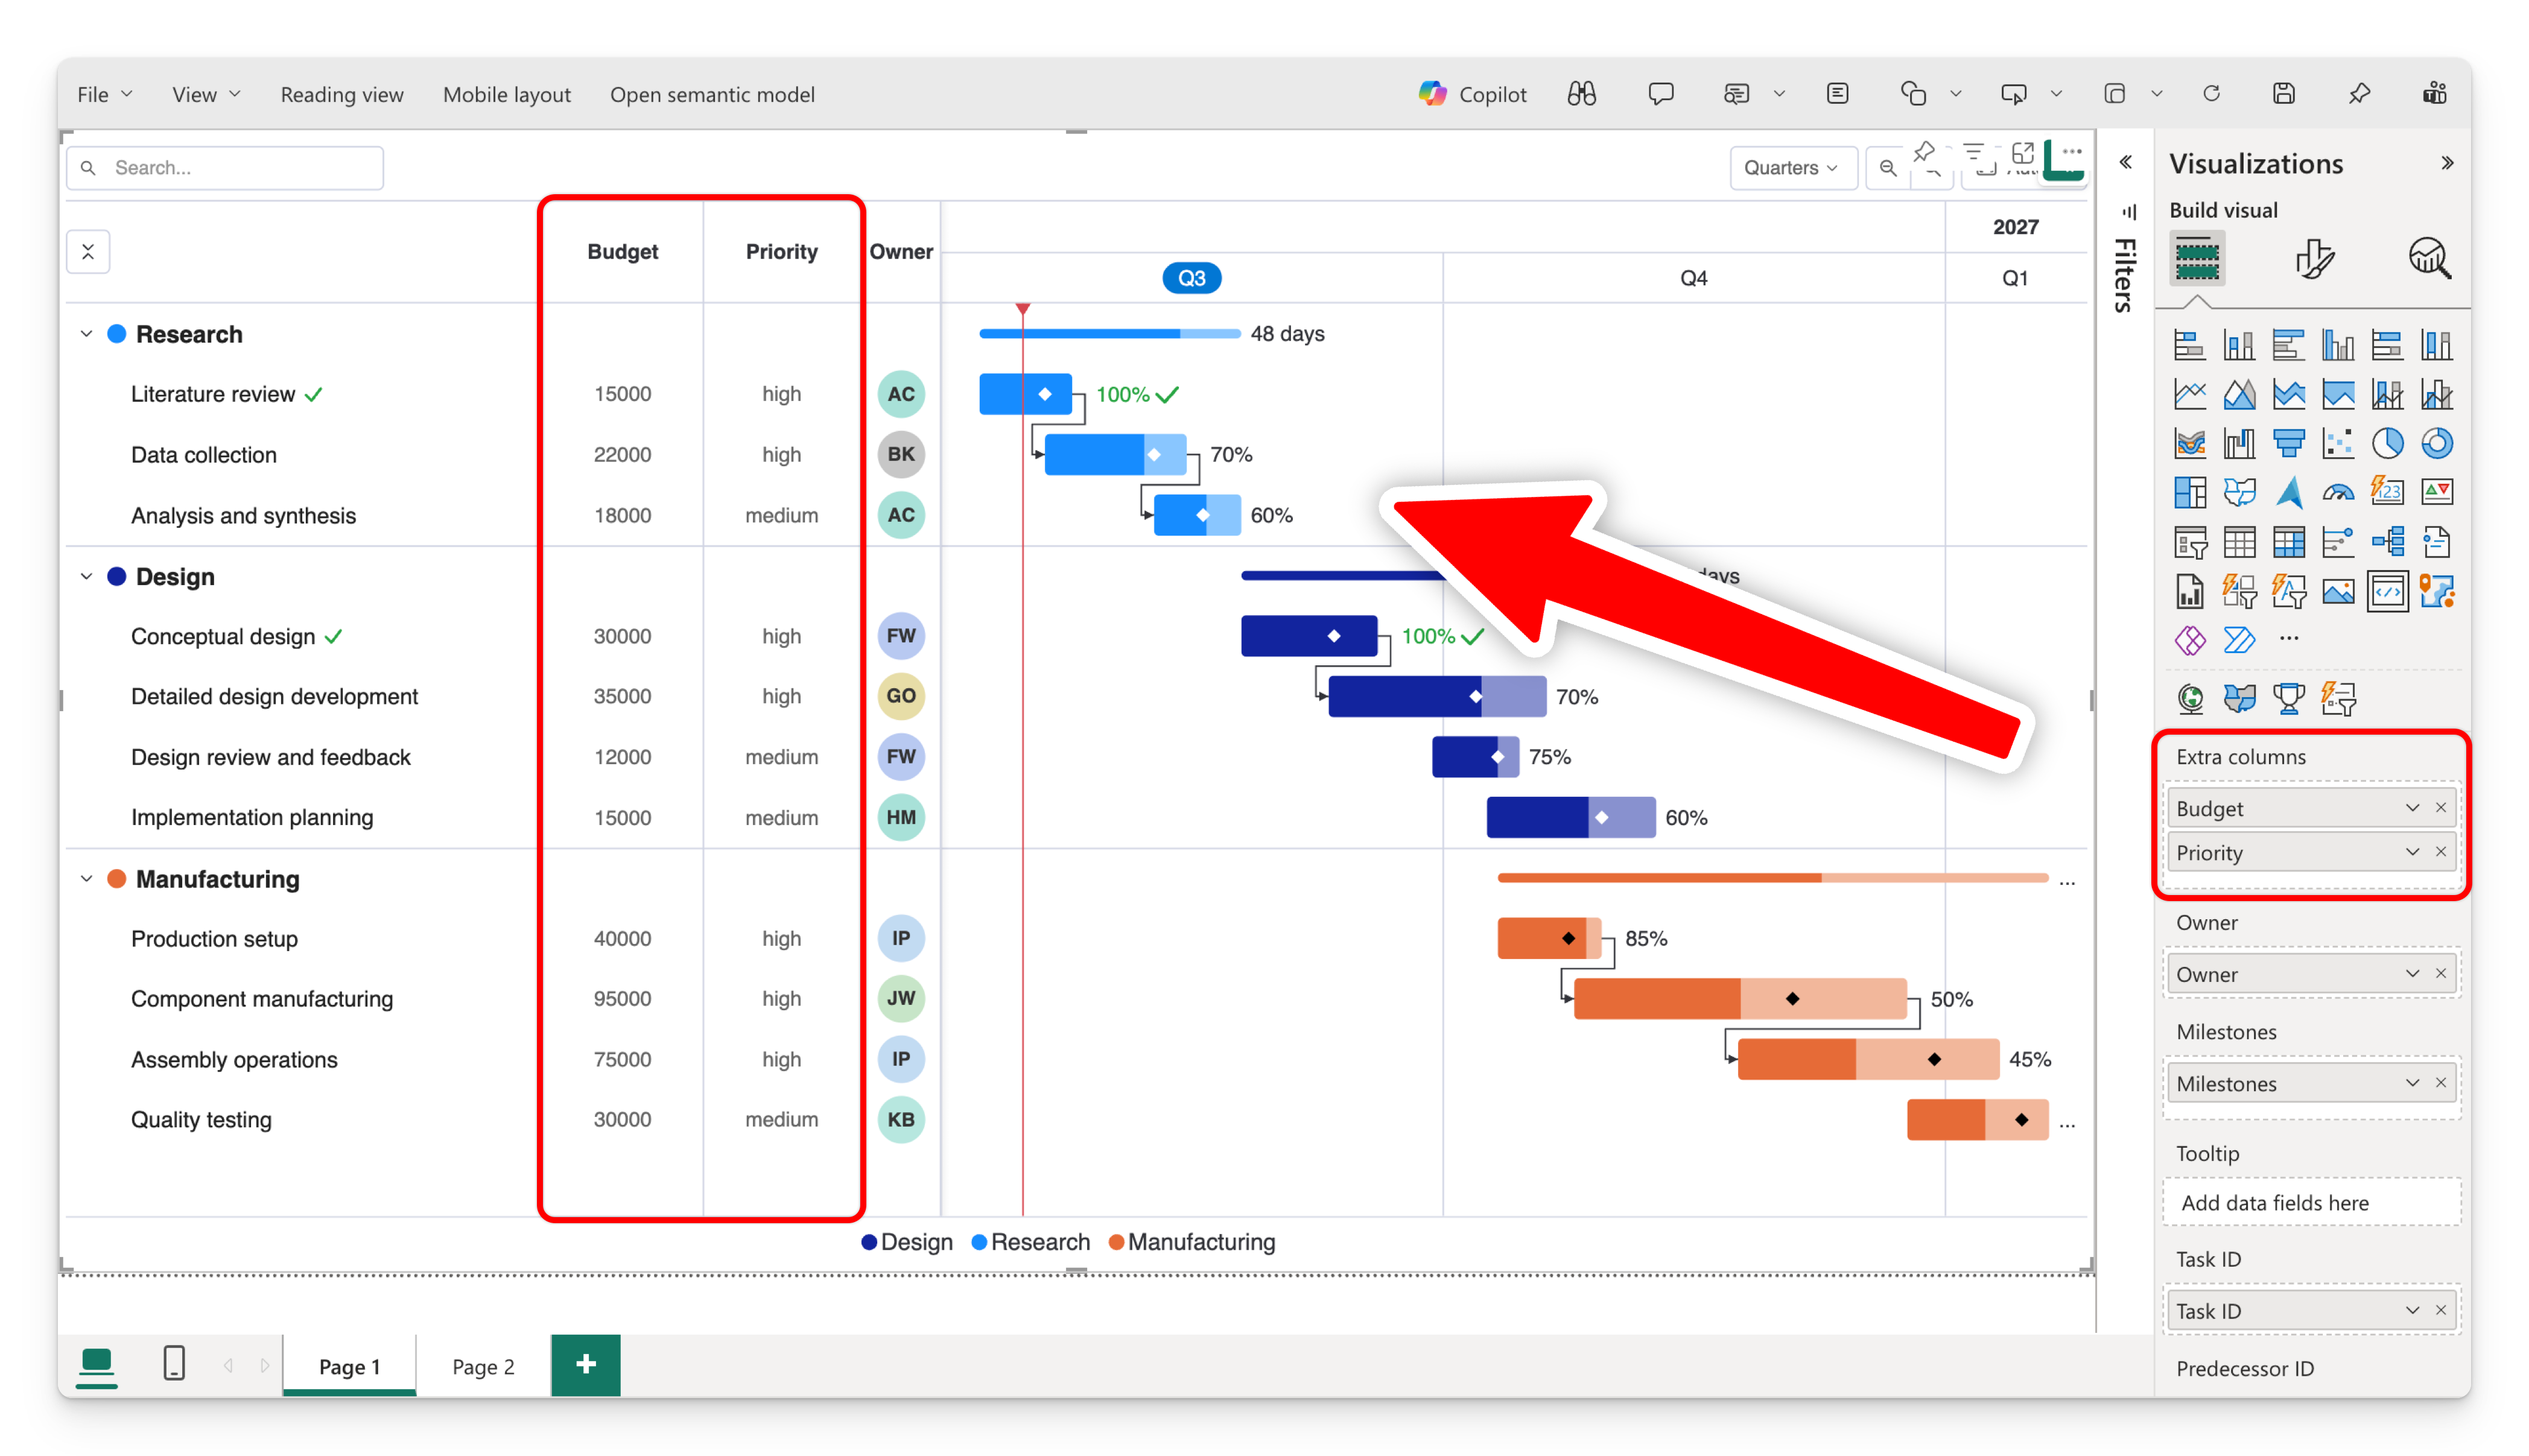
| Extra columns | No | 3 | Extra data columns beside the task list |
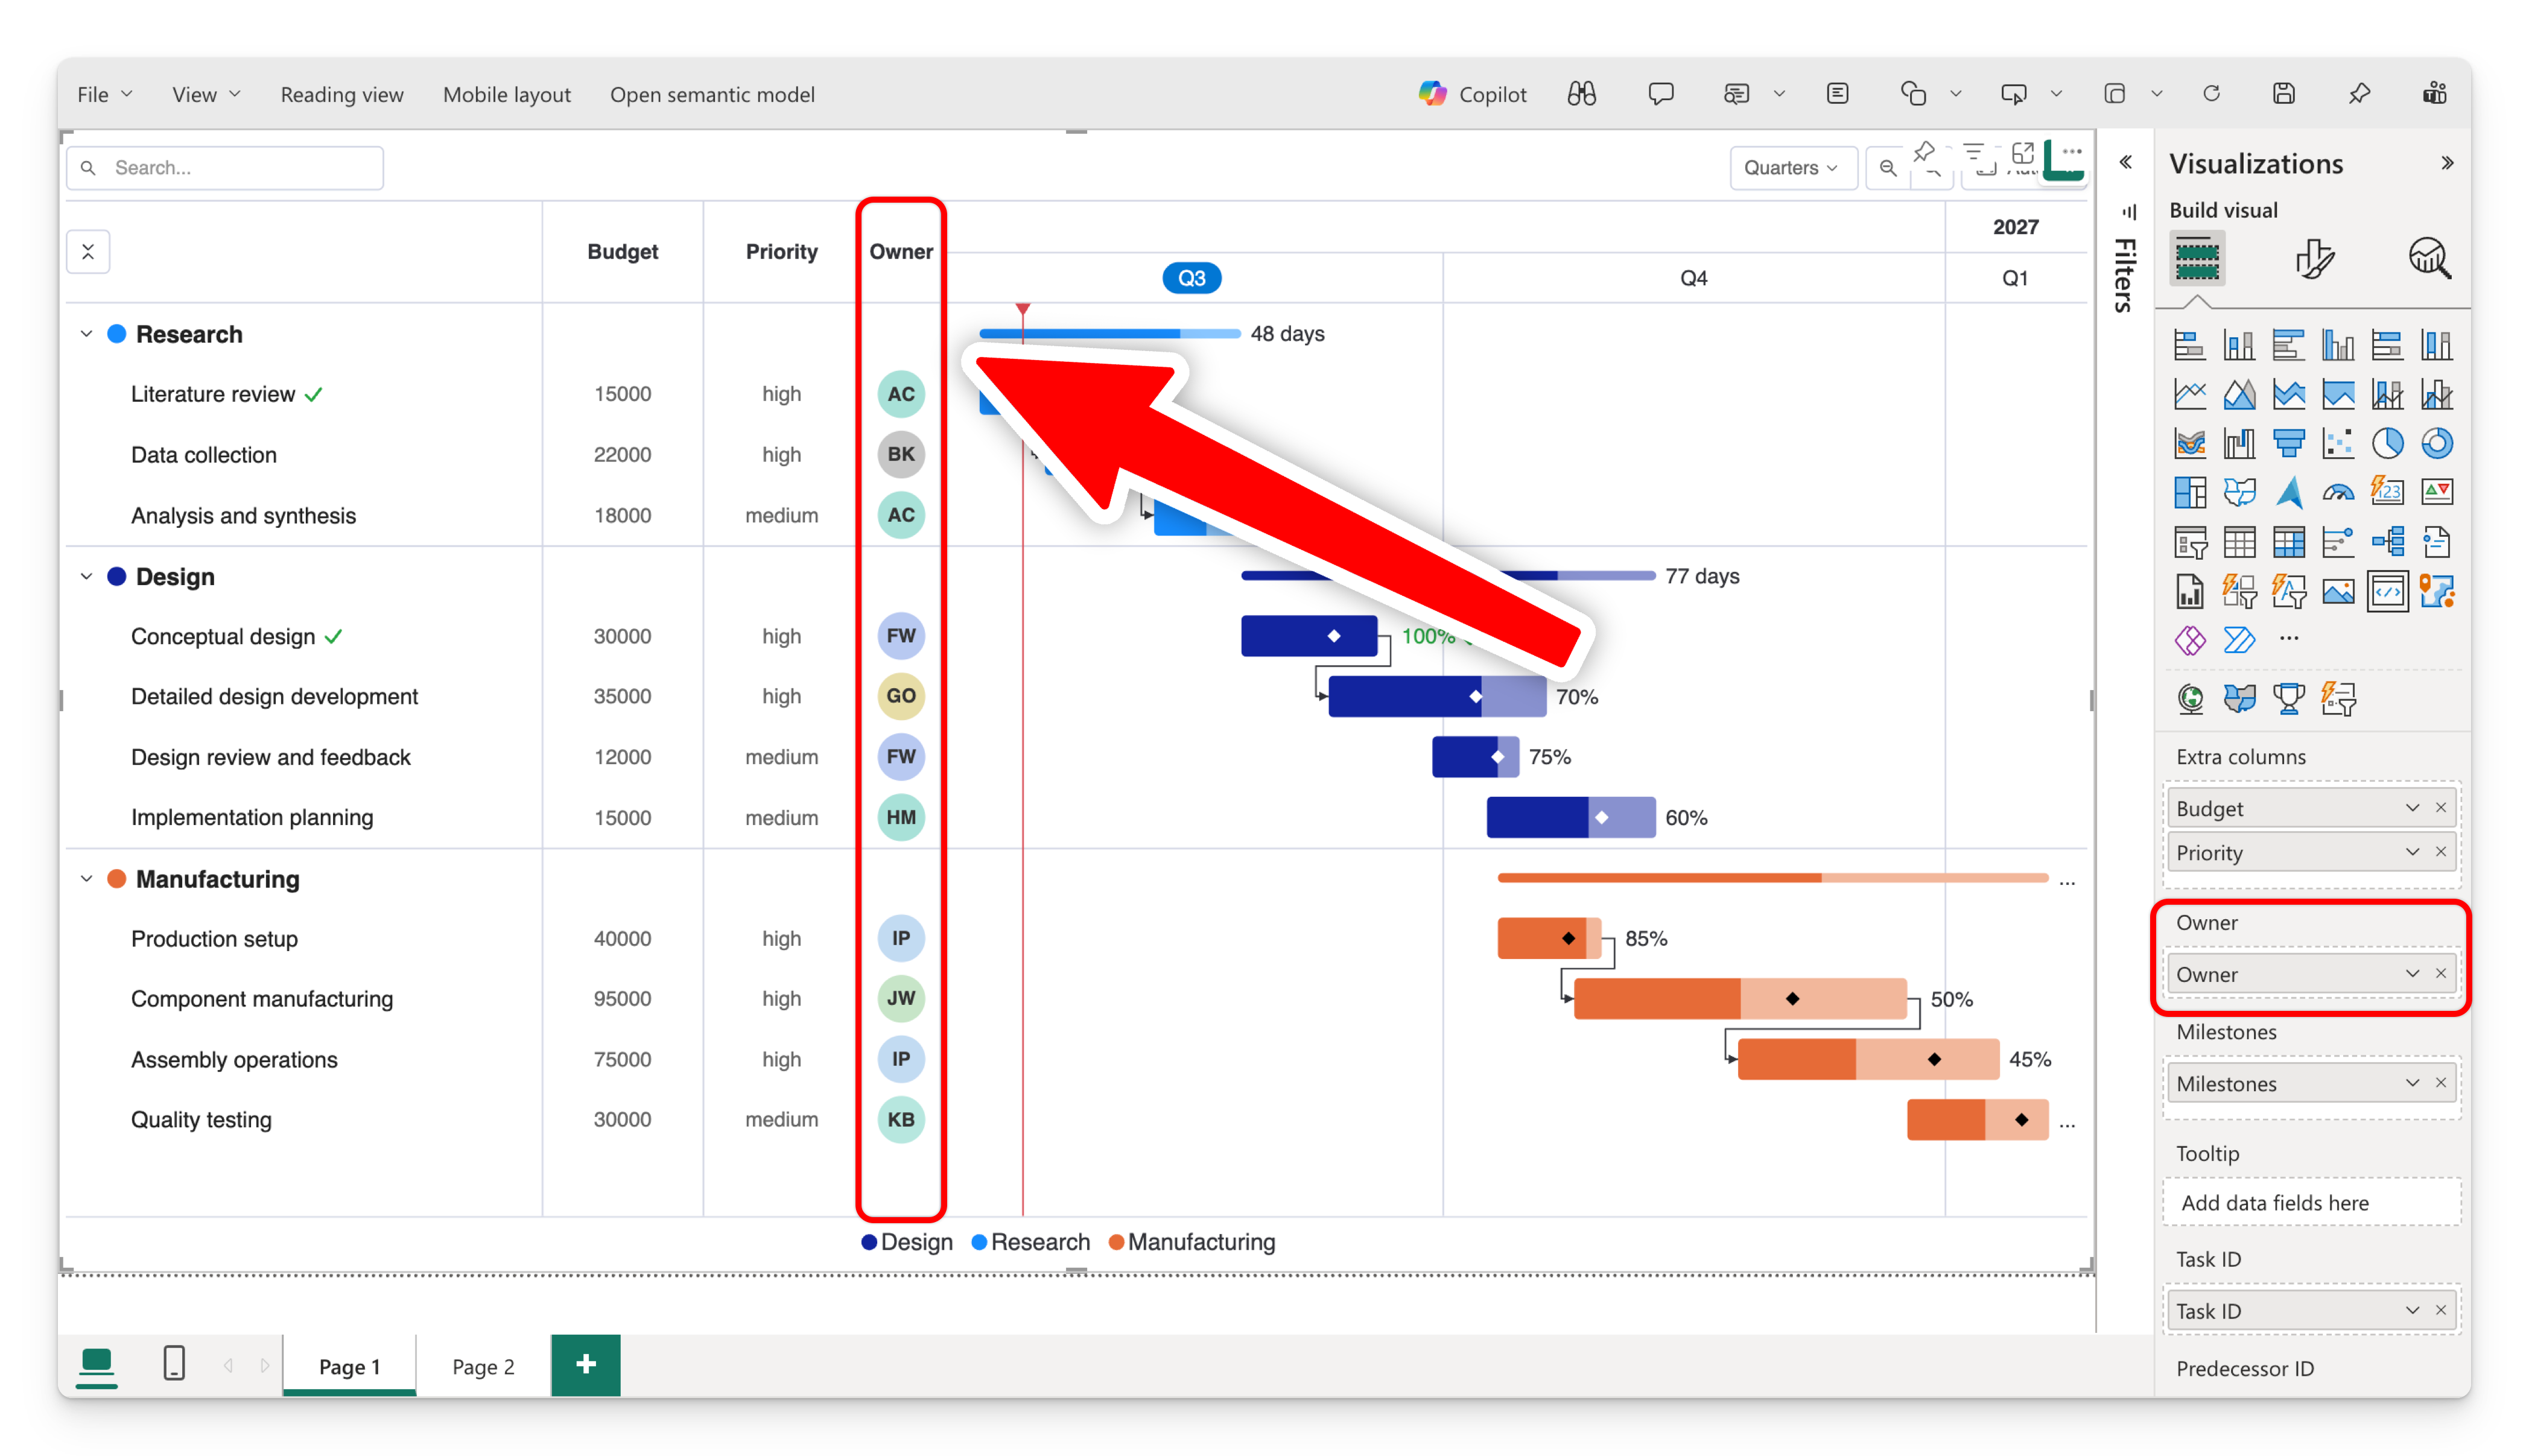
| Owner | No | 1 | Owner initials in a circle |
| Task milestones | No | 5 | Date columns shown as markers |
| Tooltip | No | 4 | Extra fields on hover |
| URLs | No | 3 | Links opened from the task list |
| Task ID | No | 1 | Unique task identifier |
| Predecessor ID | No | 1 | Tasks this task depends on |
Category (the task hierarchy)
Required · up to 10 columns · grouping field
Category defines the rows of your chart and their nesting. Each column you add is one level of the hierarchy, from left (top level) to right (deepest level):
- One column → a flat list of tasks.
- Two columns → projects (level 1) with tasks nested underneath (level 2).
- Up to ten columns → deep project → phase → task → sub-task structures.
Parent rows automatically become summary bars that span all of their children, and each parent can be expanded or collapsed in the task list.
| Project | Task |
|---|---|
| Website relaunch | Discovery |
| Website relaunch | Design |
| Marketing | Campaign brief |
In this example, "Website relaunch" and "Marketing" are top-level summary rows; the tasks nest beneath them.
Order your Category columns from broadest to most specific. The first column is always the outermost group.
Parent rows roll up automatically — a parent's bar spans the earliest start and latest end of its children, and its progress is the rolled-up progress of those children.
Start date & End date
Required · 1 column each · measures
These set where each task bar begins and ends on the timeline. Both must be a Date or Date/Time type in your model. A task with a start but no end (or vice-versa) can't be drawn, so make sure every task row has both.
If your dates arrive as text, convert them to a date type in Power Query or the model before assigning them here.
Progress bar
Optional · 1 column · measure · values 0–100
A measure representing how complete each task is, as a percentage from 0 to 100. The value fills the task bar so you can see progress at a glance. You can choose how the fill looks (a strip or an overlay) and whether the percentage is shown as a label — see Progress, colors & appearance.
Planned progress
Optional · 1 column · measure · values 0–100
A second percentage (0–100) representing where a task should be. When supplied alongside Progress bar, the chart can show planned vs. actual so you can spot tasks that are ahead of or behind plan.
Legend
Optional · 1 column · measure
The field used to color the task bars. For example, color by Status, Team, or Phase. When a Legend field is present, each distinct value gets its own color (which you can override), and a legend can be shown around the chart.
Extra columns
Optional · up to 3 columns · measures
Up to three additional data columns displayed between the task list and the timeline — useful for showing values like effort, budget, or a status code next to each task.
Owner
Optional · 1 column · measure
The task owner's name. The visual shows it as initials inside a colored circle on each row, with a consistent color per owner. Great for seeing who's responsible without widening the task list.
Task milestones
Optional · up to 5 columns · measures (dates)
One to five date columns, each plotted as a marker on the task's row. Use them for key dates such as kickoff, review, or go-live. Each milestone column can have its own marker symbol (circle, diamond, square, triangle, or star) and you can control marker size and whether markers outside a bar are hidden — see Milestones.
Tooltip
Optional · up to 4 columns · measures
Extra fields shown in the hover tooltip when someone points at a task bar, on top of the built-in details. Use it to surface context (owner, budget, notes) without cluttering the chart. The visual also supports Power BI report page tooltips.
URLs
Optional · up to 3 columns · measures
Up to three columns of web addresses, turned into links on the task. A task with at least one link shows a link icon in the task list; clicking it opens the address. With two or three links, the icon opens a small menu instead, and each entry is labelled with its column name — so name your columns for what they point at (Specification, Ticket, Dashboard).
| Task | Specification | Ticket |
|---|---|---|
| Design | https://contoso.sharepoint.com/design-spec | https://contoso.atlassian.net/browse/AB-42 |
A few things to know:
- Links are leaf-only. Summary and project rows don't show the icon — only the tasks at the bottom of the hierarchy do.
- Only
httpandhttpsaddresses work. Anything else — a relative path, afile:path, a blank value, or an address over 2,048 characters — is ignored, and the task simply shows no icon. - Keyboard users open the links with → (right arrow) on a task row. See Keyboard navigation.
There's no Format pane setting for this — binding the field is the on/off switch.
Task ID & Predecessor ID
Optional · 1 column each · measures · required for dependency arrows
These two fields work together to draw dependency arrows between tasks:
- Task ID — a unique identifier for each task (e.g.
1,2,A10). - Predecessor ID — the ID(s) of the task(s) a given task depends on. Multiple predecessors are separated by commas or semicolons (e.g.
1,2or3;4).
| Task ID | Task | Predecessor ID |
|---|---|---|
| 1 | Discovery | |
| 2 | Design | 1 |
| 3 | Build | 2 |
| 4 | Launch | 3 |
Full setup and styling is covered in Dependencies.
Task IDs must be unique. If two tasks share an ID, the arrows can't resolve which task a predecessor refers to.
How much data the visual can show
The Gantt Chart loads large datasets in segments of 30,000 rows, up to a total of 90,000 rows. While the segments are arriving you'll see a "Loading tasks…" notice with a running row count.
If your data goes past 90,000 rows, the chart renders what it loaded and shows a dismissible notice reading "Showing the first N rows — the dataset is too large to load completely." The chart is still accurate for the rows it has, but it isn't the whole picture — filter the data down, or raise the level of the hierarchy, so the visual receives less.
Rows here means rows delivered to the visual, not tasks on screen. Filtering the report, or summarizing at a higher level of the hierarchy, is almost always faster and easier to read than plotting tens of thousands of bars.
Next steps
- Timeline & navigation — control the time scale and starting view.
- Tasks, milestones & dependencies — hierarchy, sorting, milestones, and arrows.
- Progress, colors & appearance — styling and layout.